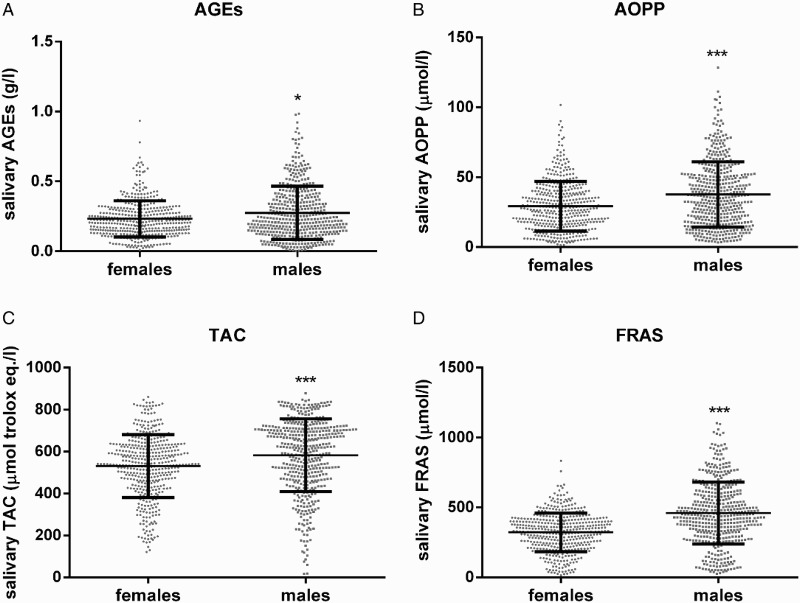
Figure 1.

Salivary AGEs (A), AOPP (B), TAC (C), and FRAS (D) levels in females and males. All analyzed samples are plotted. AGEs – advanced glycation end-products, AOPP – advanced oxidation protein products, TAC – total antioxidant capacity, and FRAS – ferric reducing ability of saliva. * denotes P < 0.05, *** denotes P < 0.001 when compared to females.
