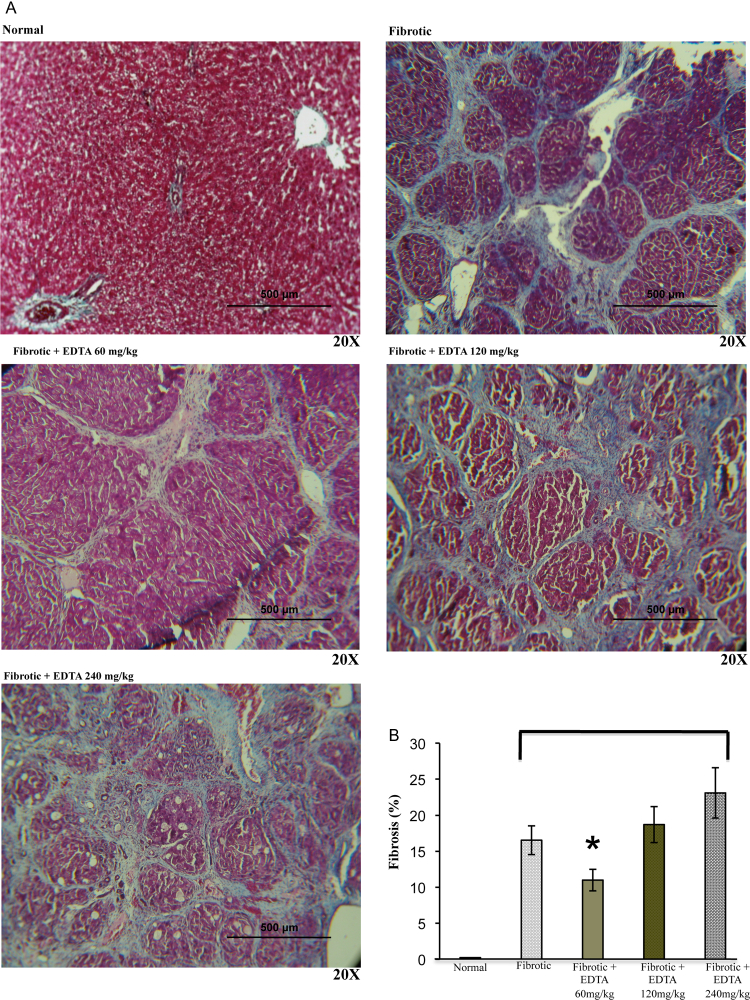
Figure 2.
(A) Fibrosis stage determination. Representative images (×20) of liver sections stained with Masson trichrome from normal, fibrotic, and EDTA-treated rats at different concentrations (60, 120, and 240 mg/kg) (B) Morphometric analysis of liver section photographs using a computerized image analyzer showed that EDTA treatment at 60 mg/kg reduced by 20% the accumulation of ECM proteins. EDTA therapy with doses of 120 and 240 mg/kg increased ECM accumulation. Values are the mean ± standard deviation of five rats per group. Asterisks indicate values significantly different (*P ≤ 0.05).

