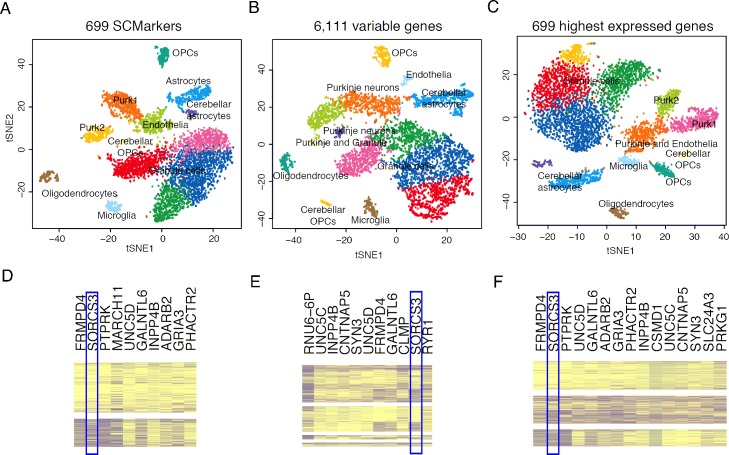
Fig 4. Results on the human brain data.
Plotted in tSNE space are 5,602 cells in the cerebellar hemisphere of human brain tissue based on markers selected respectively by (A) SCMarker, (B) the highest variable genes and (C) the highest expressed genes, colored by performing clustering using Seurat. Cell types were labelled consistently as they were in the original paper. Also plotted are the heatmaps of the top 10 gene expression levels derived respectively from (D) SCMarker in cluster 4 and 7, (E) the highest variable genes in cluster 4, 6 11 and 12 and (F) the highest expressed genes in cluster 3, 4 and 6.

