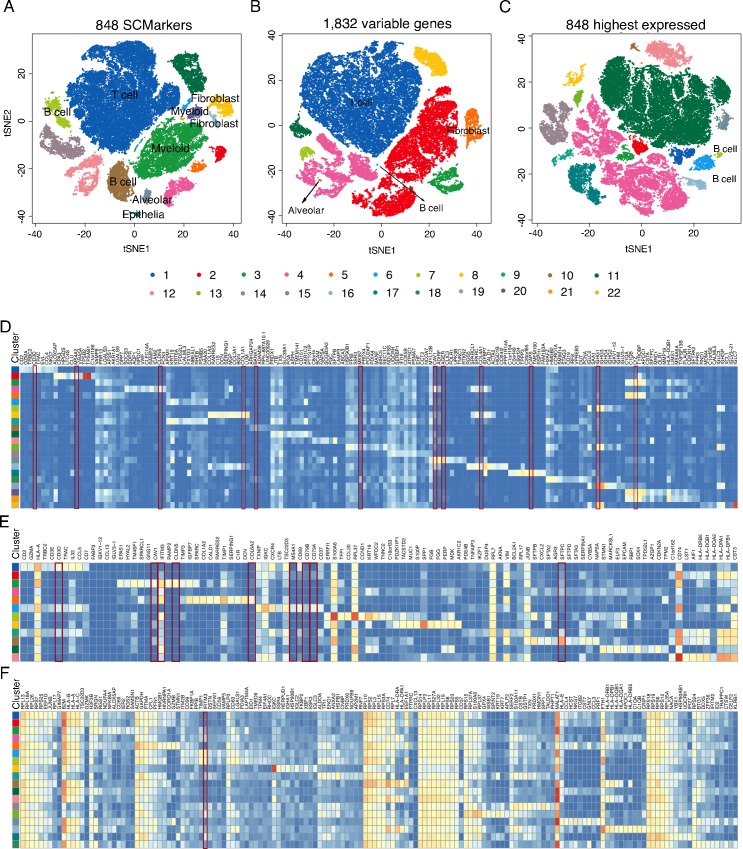
Fig 5. Results on the lung cancer data generated by Dropseq.
Plotted in tSNE space are 52,698 cells of 6 different lung cancer patients, clustered based on markers selected respectively by (A) SCMarker, (B) the highest variable genes and (C) the highest expressed genes. Colors correspond to clusters determined by DBSCAN. Heatmaps of the average expression levels of the 10 highest expressed genes per cluster identified respectively by SCMarker (D), the highest variable genes (E) and the highest expressed genes (F). Cell types in (A) to (C) are labelled based on the known cell-type specific markers (Table 1), which are highlighted in red boxes in (D) to (F).

