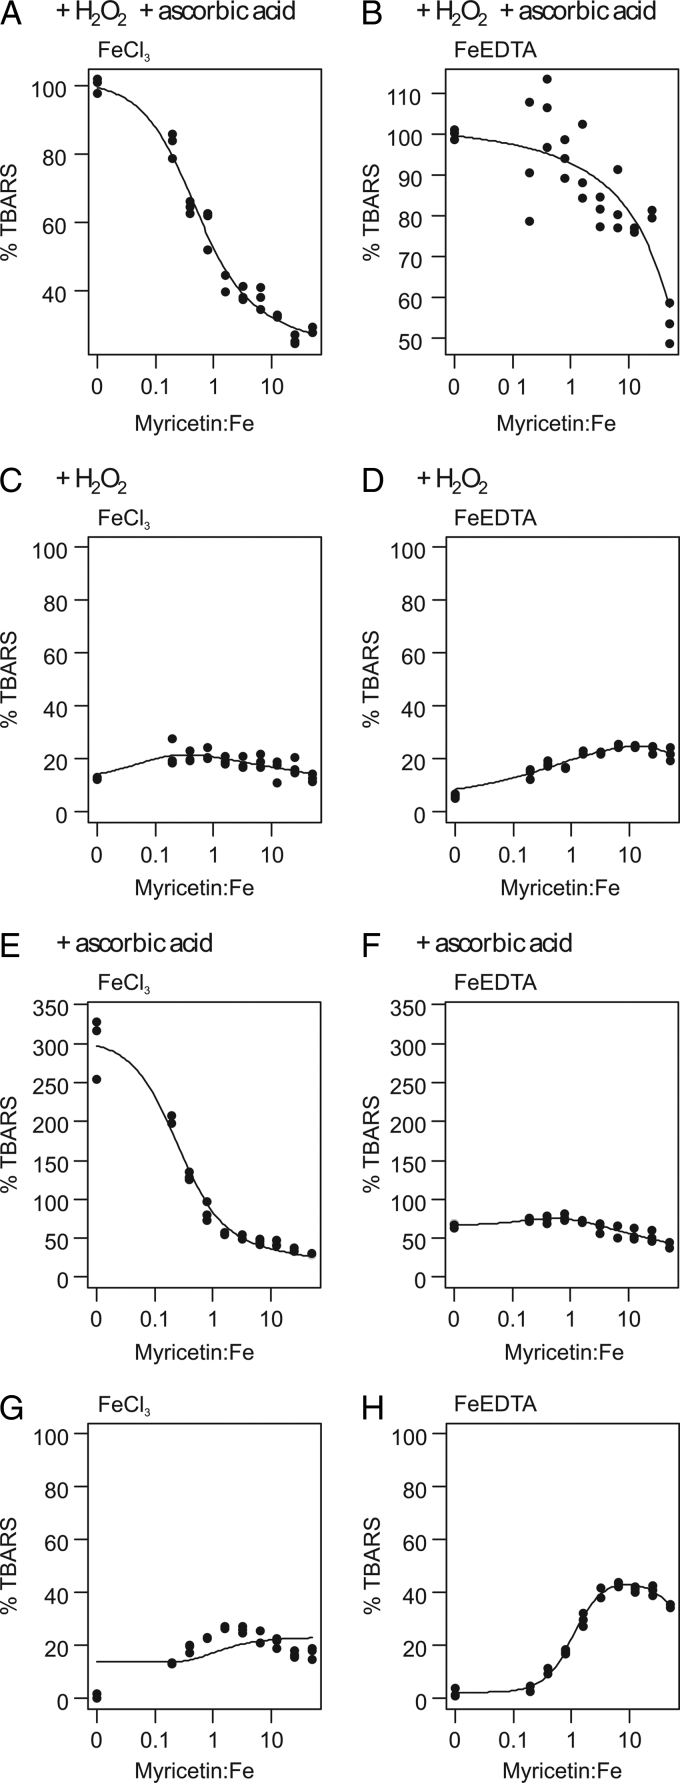
Figure 3.
Dose–response curves of TBARS formation depending on the myricetin:Fe ratio in various systems and variants of the deoxyribose degradation assay; 100% TBARS represents mean formation in the FeCl3 or FeEDTA variant of the classical ascorbic acid–H2O2 system; X-axis has logarithmic scaling but values are not transformed.

