
Figure 2.
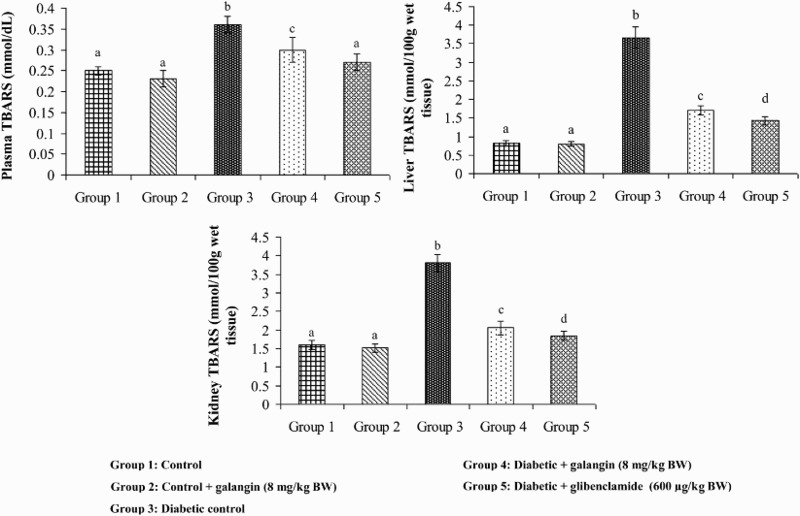
Effect of galangin on TBARS in the plasma and tissues of normal and STZ-induced diabetic rats. Values are given as means ± SD from six rats in each group. Group 1 is significantly not different from group 2 (a, a) (P < 0.05). Group 4 and 5 are significantly different from group 3 (b vs. c, a, d) (P < 0.05).