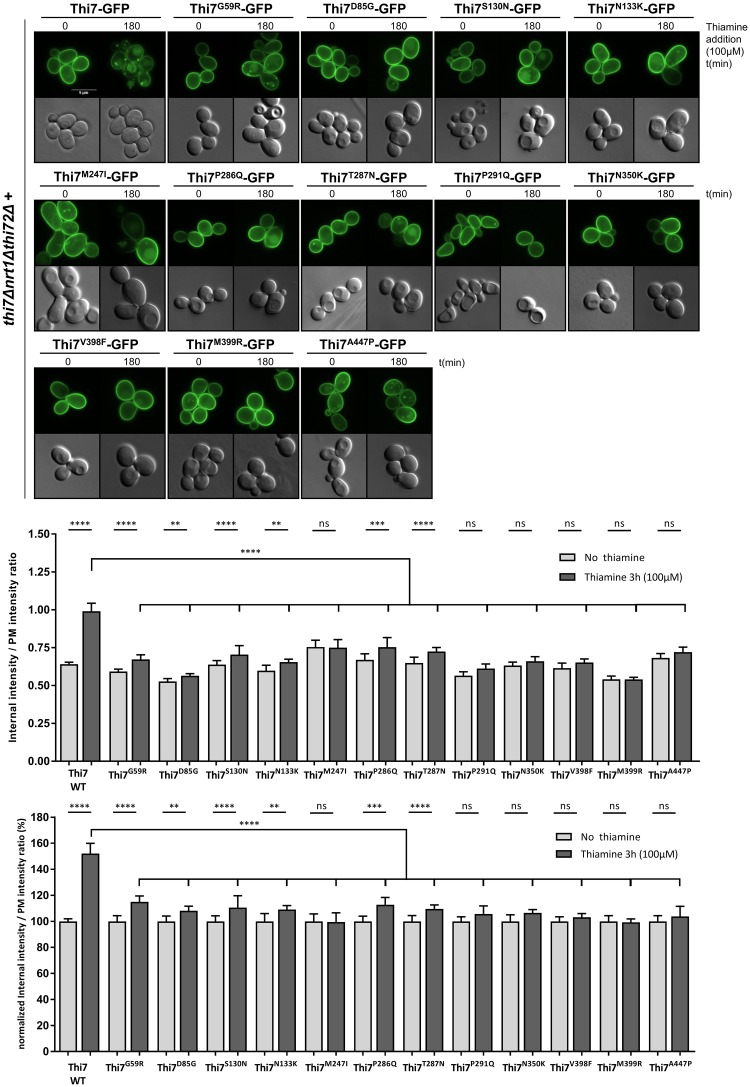
Fig 5. Single-point Thi7 mutants display thiamine-induced endocytic defects compared to WT Thi7.
Localization of Thi7 mutants in a thi7Δnrt1Δthi72Δ strain after thiamine addition (final concentration: 100 μM) for 3 h into culture grown in thiamine-free selective medium. Scale bar represents 5 μm. Quantification shows the ratio of internal-over-PM fluorescence intensity of all single-point Thi7 mutants before and after thiamine addition (100 μM) as described in the Materials and methods section (n > 69 cells per condition in 3 replicates). The upper graph is data not normalized, whereas the bottom graph is data normalized for each mutant by the ratio at time 0. (****p < 0.0001; ***p < 0.001; **p < 0.01; *p < 0.05) The numerical data are included in S3 Data. GFP, green fluorescent protein; ns, nonsignificant; PM, plasma membrane; WT, wild type.

