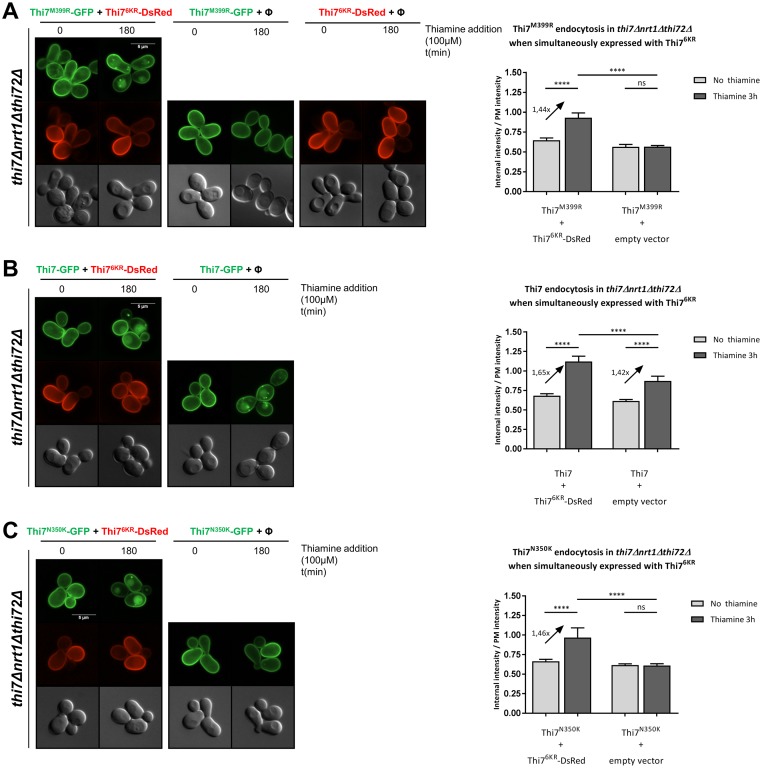
Fig 6. Thiamine uptake through Thi76KR leads to endocytosis of the inactive Thi7 transporters.
(A) Localization of Thi7M399R-GFP and Thi76KR-mDsRed after incubation with thiamine (final concentration: 100 μM) in a thi7Δnrt1Δthi72Δ strain coexpressing THI7M399R-GFP and THI76KR-mDsRed, or THI7M399R-GFP with an empty vector (pRS313; Φ) or THI76KR-mDsRed with an empty vector (pRS316; Φ). Relative quantification of the internal-over-PM fluorescence intensity ratio of Thi7M399R-GFP before and after incubation with thiamine (100 μM) when coexpressed with Thi76KR-mDsRed or an empty vector (pRS313; Φ). (B) Localization of Thi7-GFP and Thi76KR-mDsRed after incubation with thiamine (final concentration: 100 μM) in a thi7Δnrt1Δthi72Δ strain coexpressing THI7-GFP with an empty vector (pRS313; Φ) or THI7-GFP with THI76KR-mDsRed. Relative quantification of the internal-over-PM fluorescence intensity ratio of Thi7M399R-GFP before and after incubation with thiamine (100 μM) when coexpressed with Thi76KR-mDsRed or an empty vector (pRS313; Φ). (C) Localization of Thi7N350K-GFP and Thi76KR-mDsRed after incubation with thiamine at a final concentration of 100 μM in a thi7Δnrt1Δthi72Δ strain coexpressing THI7N350K-GFP and either THI76KR-mDsRed or an empty vector (pRS313; Φ). Relative quantification of the internal-over-PM fluorescence intensity of Thi7N350K-GFP before and after incubation with thiamine (100 μM) when coexpressed with either Thi76KR-mDsRed or an empty vector (pRS313; Φ). For quantification, the median with 95% confidence interval is presented (n > 94 cells per condition in 3 biological replicates) (****p < 0.0001, Wilcoxon test). Scale bar represents 5 μm. The numerical data are included in S4 Data. GFP, green fluorescent protein; ns, nonsignificant; PM, plasma membrane.

