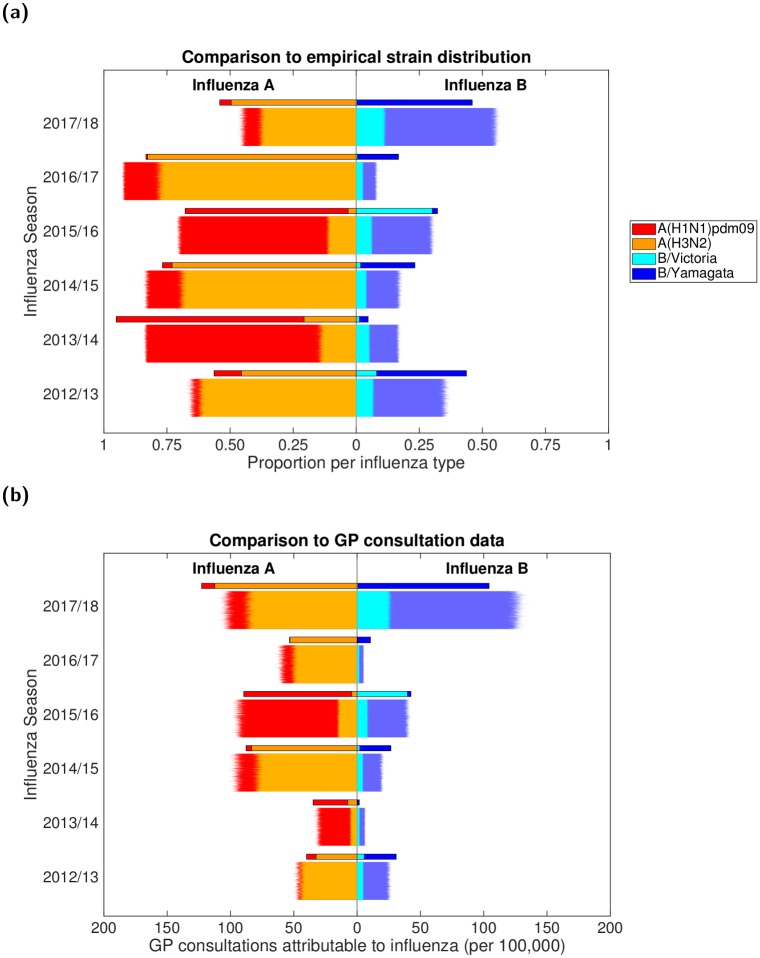
Fig 5. Posterior predictive distributions for strain composition and influenza positive GP consultations per 100,000 population.
Stratified by influenza season, we present back-to-back stacked bars per simulation replicate, with 1,000 replicates performed, each using a distinct parameter set representing a sample from the posterior distribution. Each influenza season is topped out by a thicker stacked horizontal bar plot, corresponding to the strain-stratified point estimates for the empirical data. (a) Posterior predictive distributions for circulating influenza virus subtype/lineage composition. (b) Posterior predictive distributions for influenza positive GP consultations per 100,000 population. In both panels, the left side depicts data pertaining to type A influenza viruses (red shading denoting the A(H1N1)pdm09 subtype, orange shading the A(H3N2) subtype). In an equivalent manner, the right side stacked horizontal bars present similar data for type B influenza (cyan shading denoting the B/Victoria lineage, dark blue shading the B/Yamagata lineage). We see a reasonable qualitative model fit to the data, especially for the two influenza A subtypes.

