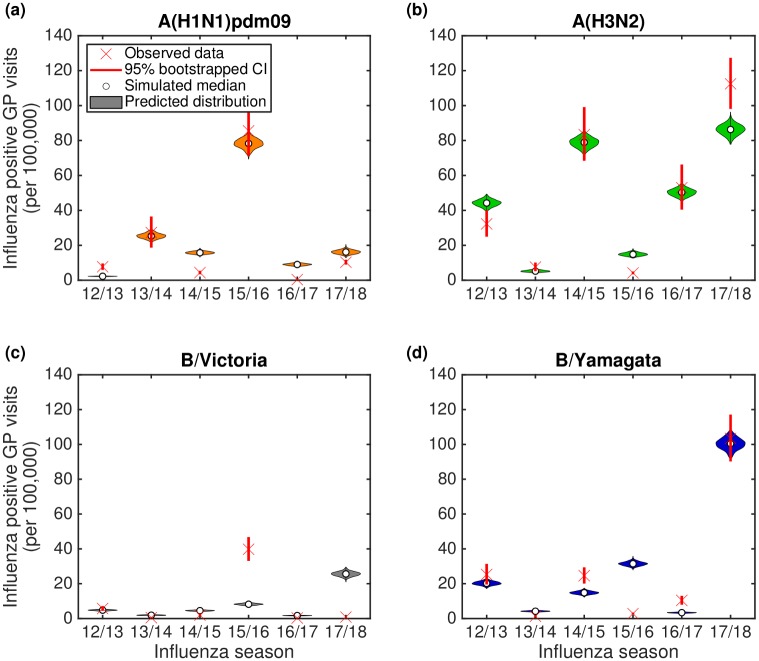
Fig 6. Violin plots depicting the posterior predictive influenza positive GP consultation distributions.
We generated the estimated distributions from 1,000 model simulations, each using a distinct parameter set from the retained collection of particles. Crosses represent the observed data, with solid bars the range of the bootstrapped empirical data. Shaded violin plots denote outcomes from model simulations using the empirical data on vaccination, with filled circles the median value across the simulated replicates. (a) A(H1N1)pdm09; (b) A(H3N2); (c) B/Victoria; (d) B/Yamagata.

