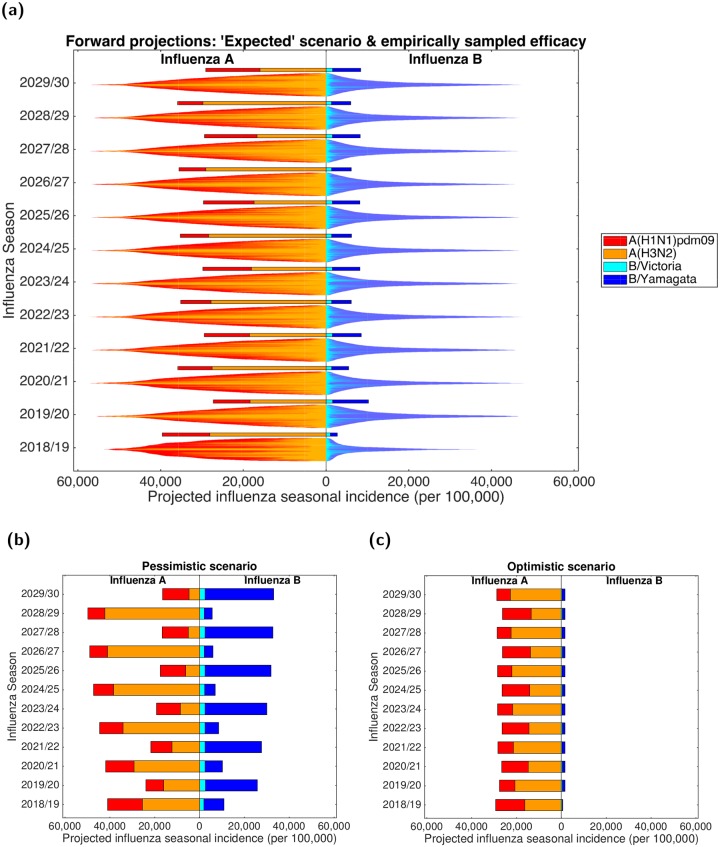
Fig 7. Projected influenza seasonal incidence (per 100,000 population) up to 2029/30.
For all scenarios, in forward simulated influenza seasons vaccine uptake matched that of the 2017/18 influenza season. In all panels, the left side depicts the seasonal incidence of type A influenza per 100,000 population (red shading denoting the A(H1N1)pdm09 subtype, orange shading the A(H3N2) subtype). The right side stacked horizontal bars present projected seasonal incidence of type B influenza per 100,000 population (cyan shading denoting the B/Victoria lineage, dark blue shading the B/Yamagata lineage).(a) Each influenza season is topped out by a thicker stacked horizontal bar plot, corresponding to the simulated estimate under the ‘expected’ vaccine efficacy scenario; efficacies by strain were as follows—A(H1N1)pdm09: 55.25%; A(H3N2): 30.45%; B/Victoria: 55.90%; B/Yamagata: 52.60%. Thin bars correspond to simulation runs where vaccine efficacy against each strain were randomly sampled from the empirical distribution (totalling 1,000 replicates). Simulations are arranged such that the largest epidemics are in the centre of the bar. (b) Projected incidence under a pessimistic vaccine efficacy scenario; efficacies by strain were as follows—A(H1N1)pdm09: 23.00%; A(H3N2): 0.00%; B/Victoria: 24.70%; B/Yamagata: 0.00%. (c) Projected incidence under an optimistic vaccine efficacy scenario; efficacies by strain were as follows—A(H1N1)pdm09: 73.00%; A(H3N2): 61.00%; B/Victoria: 92.00%; B/Yamagata: 92.00%.

