Figure 1.
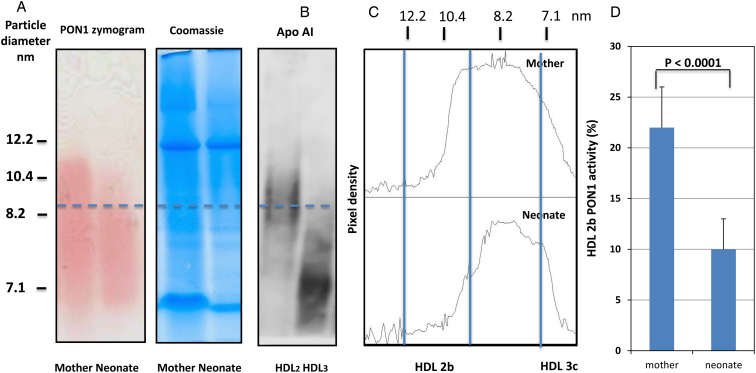
PON1 activity in the HDL subclasses from the neonates and their mothers separated by the native gradient electrophoresis gels. (A) The PON1 zymogram of a typical and representative pair of the mother and her newborn and Coomassie staining of the same gel for load and migration control. The HDLs were separated by their hydrodynamic diameter in an 8 × 10 × 0.15 cm3 non-denaturing 4–12% gradient PAGE (Novex® 4–12% Tris-Glycine gel, Invitrogen, Carlsbad, CA, USA) as described in the Materials and methods section. PON1 activity in the HDL subclasses was determined by the enzymatic detection of the PON1 hydrolysis of phenylacetate in situ (by means of a coupled reaction with aminoantipyrine and potassium ferricyanide, which quantitatively measures phenol, the product, at 405 nm, as described in the Materials and methods section. (B) A western blot that localizes the apoAI in the purified HDL2 and HDL3 which allows us to better determine the cut-off points for quantitation. (C) The densitometry profiles as indicated (same runs as in A). The relative proportions of the PON1 activity in each HDL subclass were estimated by optical densitometry analysis employing the Image J software (NIH, Bethesda, MA, USA), using as reference the globular proteins (thyroglobulin, 17 nm; ferritin, 12.2 nm; lactate dehydrogenase, 8.2 nm; and albumin, 7.1 nm: high-molecular weight calibration kit, Amersham Pharmacia Biotech, Buckimghamshire, UK) that were run in each gel. (D) The relative activity of PON1 in HDL2b measured as area under the curve for the PON1 activity in HDL2b/total PON1 activity.

