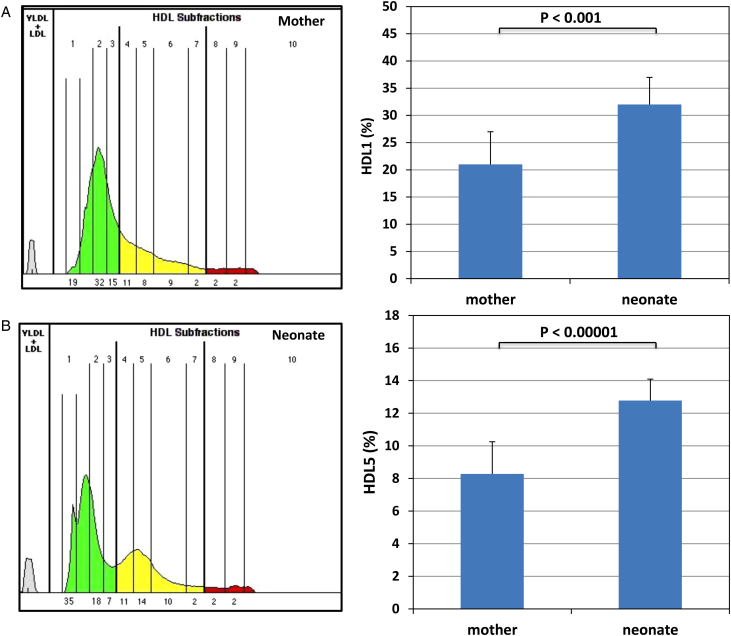
Figure 2.
Lipid distribution in the HDL subclasses from the neonates and their mothers separated by Lipoprint. A typical and representative pair of the mother (A) and her newborn (B) is depicted. Sera were analyzed by using the Lipoprint HDL subfraction analysis system from Quantimetrix according to the manufacturer's instructions. For quantification, scanning was performed with the manufacturer's scanner and stained HDL subclasses were identified by their mobility after electrophoresis. The LDL/VLDL band was the starting reference point (Rf 0.0) and albumin was the ending reference point (Rf 1.0). AUC% were calculated with the Lipoware computer software (Quantimetrix Corp.). Up to 10 HDL subfractions, distributed between the LDL/VLDL and the albumin bands are detected. The most striking differences are an increase in HDL1 and a prominent HDL5 in the neonates. See also Table 3 for a complete quantitative analysis.

