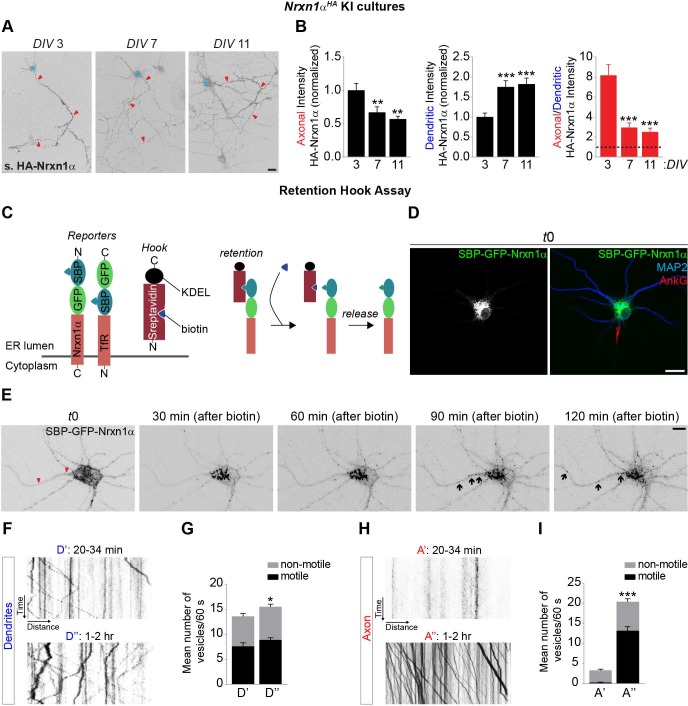
Fig 2. Indirect axonal trafficking of Nrxn1α in mature neurons.
(A) Nonpermeabilized DIV3, DIV7, and DIV11 Nrxn1αHA cortical neurons live-labeled with an HA antibody to visualize endogenous surface (s.) HA-Nrxn1α (grayscale) in axon and dendrites. Red arrowheads indicate the axon, and the blue asterisk marks the cell body. (B) Quantification of panel A: surface HA-Nrxn1α fluorescence intensity in axon and dendrites normalized to DIV3 neurons and the ratio of axonal–dendritic surface HA-Nrxn1α intensity. DIV3 (n = 30 neurons); DIV7 (n = 29); DIV11 (n = 24). **P < 0.01; ***P < 0.001 (Kruskal-Wallis test followed by Dunn’s multiple comparisons test, 3 independent cultures). (C) Schematic representation of streptavidin-KDEL (ER hook) and reporters (Nrxn1α and TfR) used in RUSH experiments. Addition of biotin dissociates the reporters from the ER hook, inducing synchronous release from the ER and transport through the secretory pathway. (D) DIV9 WT mouse cortical neuron co-expressing SBP-EGFP-Nrxn1α and streptavidin-KDEL immunostained for MAP2 (blue), Ankyrin-G (red), and EGFP-Nrxn1α (grayscale and green) at t = 0 before adding biotin. (E) Live-cell imaging in DIV8 to DIV10 WT rat cortical neurons co-expressing SBP-EGFP-Nrxn1α and ER hook. After 24 to 31 h of expression, neurons were imaged every 5 min for 2.5 h. Biotin was added 10 min after the beginning of the imaging session. Shown are representative images of SBP-EGFP-Nrxn1α fluorescence in dendrites and axon before (t0) and 30, 60, 90 and 120 min after adding biotin. Red arrowheads indicate axon and black arrows indicate SBP-EGFP-Nrxn1α-positive puncta. See also S1 Movie. (F–I) Live-cell imaging in DIV8 to DIV10 WT rat cortical neurons co-expressing SBP-EGFP-Nrxn1α and ER hook. After 21 to 30 h of expression, neurons were imaged every second for 60 to 120 s either 20 to 34 min or 1 to 2 h after adding biotin. See also S2 Movie and S3 Movie. (F) Kymographs illustrating EGFP-Nrxn1α vesicle dynamics over a 60 s period in dendrites (D) from neurons treated with biotin for either 25 min or 2 h. (G) Mean number of motile and nonmotile EGFP-Nrxn1α vesicles in dendrites from neurons treated with biotin for either 20 to 34 min (n = 17 neurons) or 1 to 2 h (n = 16) in 2 and 3 independent experiments, respectively. *P < 0.05 (Mann-Whitney test). (H) Kymographs illustrating EGFP-Nrxn1α vesicle dynamics over a 60 s period in axons (A) from neurons treated with biotin for either 25 min or 2 h. (I) Mean number of motile and nonmotile EGFP-Nrxn1α vesicles in axons. ***P < 0.001 (Mann-Whitney test). Underlying numerical values can be found in S1 Data. Graphs show mean ± SEM. Scale bars, 20 μm (panels A and D); 10 μm (panel E). AnkG, Ankyrin-G; DIV, days in vitro; ER, endoplasmic reticulum; EGFP, enhanced green fluorescent protein; HA, hemagglutinin; KDEL, endoplasmic reticulum retention signal KDEL; KI, knock in; MAP2, microtubule-associated protein 2; Nrxn, neurexin; RUSH, retention using selective hooks; SBP, streptavidin-binding protein; TfR, transferrin receptor; WT, wild type.

