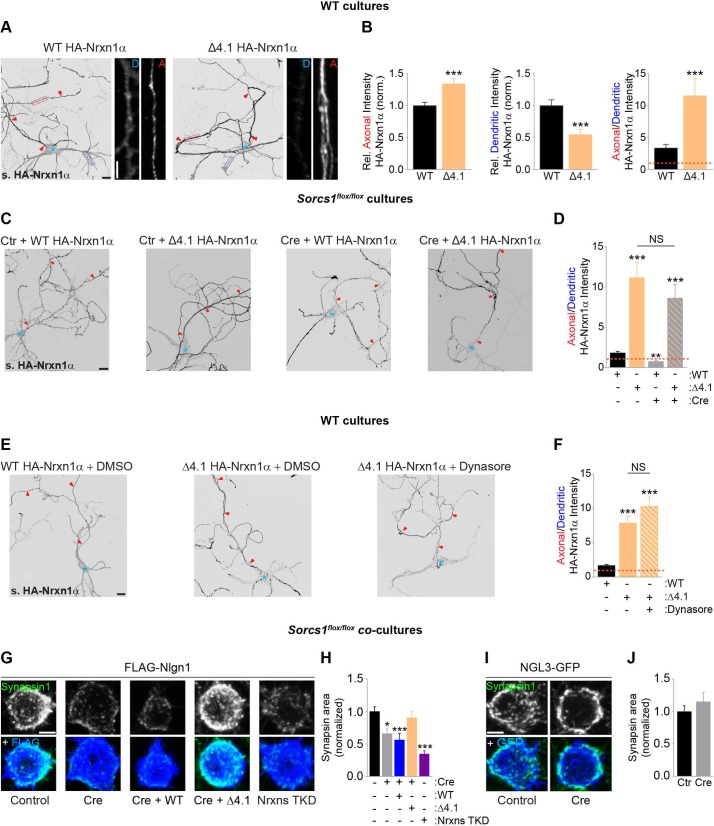
Fig 4. SorCS1-mediated axonal surface polarization of Nrxn is required for presynaptic differentiation.
(A) DIV8 to DIV10 WT mouse cortical neurons transfected with WT HA-Nrxn1α and a cytoplasmic deletion mutant lacking the 4.1-binding motif (HA-Nrxn1α Δ4.1) and immunostained for surface (s.) HA-Nrxn1α (grayscale). Red arrowheads indicate the axon, and the blue asterisk marks the cell body. High-zoom images show dendritic (D, dotted blue box) and axonal (A, dotted red box) HA-Nrxn1α. (B) Quantification of panel A: surface HA-Nrxn1α fluorescence intensity in axon and dendrites relative to total surface levels and normalized to cells expressing WT-Nrxn1α and ratio of axonal–dendritic surface HA intensity. WT (n = 30 neurons); Δ4.1 (n = 29). ***P < 0.001 (Mann-Whitney test, 3 independent experiments). (C) DIV8 to DIV10 mouse Sorcs1flox/flox cortical neurons electroporated with EGFP (Ctr) or Cre-EGFP (Cre) and transfected with WT HA-Nrxn1α or HA-Nrxn1α Δ4.1. Neurons were immunostained for surface HA-Nrxn1α (grayscale). (D) Quantification of panel C: ratio of axonal–dendritic surface HA-Nrxn1α fluorescence intensity. Ctr_WT (n = 46 neurons); Ctr_Δ4.1 (n = 25); Cre_WT (n = 30); Cre_Δ4.1 (n = 27). **P < 0.01; ***P < 0.001 (Kruskal-Wallis test followed by Dunn’s multiple comparisons test, at least 3 independent experiments). (E) DIV8 to DIV10 WT mouse cortical neurons transfected with WT HA-Nrxn1α or HA-Nrxn1α Δ4.1 and treated with DMSO (vehicle) or Dynasore. Neurons were immunostained 18 h after treatment for surface HA-Nrxn1α (grayscale). (F) Quantification of panel E: ratio of axonal–dendritic surface HA fluorescence intensity. WT_DMSO (n = 40 neurons); Δ4.1_DMSO (n = 40); Δ4.1_Dynasore (n = 28). ***P < 0.001 (Kruskal-Wallis test followed by Dunn’s multiple comparisons test, at least 3 independent experiments). (G) HEK293T-cells expressing FLAG-Nlgn1 co-cultured with DIV10 Sorcs1flox/flox cortical neurons infected with LV expressing mCherry (Control), Cre-T2A-mCherry, Cre-T2A-mCherry-T2A-WT Nrxn1α, Cre-T2A-mCherry-T2A-Nrxn1α Δ4.1, or Nrxn TKD; immunostained for FLAG (blue) and Synapsin1 (grayscale and green). (H) Quantification of panel G: the area of Synapsin1 clustering on the surface of Nlgn1-expressing HEK cells and normalized to cells expressing mCherry. Control (n = 29 neurons); Cre (n = 30); Cre-WT (n = 30); Cre-Δ4.1 (n = 30); TKD Nrxns (n = 30). *P < 0.05; ***P < 0.001 (Kruskal-Wallis test followed by Dunn’s multiple comparisons test, 3 independent experiments). (I) HEK293T-cells expressing NGL-3-EGFP co-cultured with DIV10 Sorcs1flox/flox cortical neurons infected with LV expressing mCherry (Control) or Cre-T2A-mCherry and immunostained for EGFP (blue) and Synapsin1 (grayscale and green). (J) Quantification of panel I. Control (n = 30 neurons); Cre (n = 30). Underlying numerical values can be found in S1 Data. Graphs show mean ± SEM. Scale bars, 20 μm (panels A, C, and E); 5 μm (panels A [high-zoom], G, and I). Cre, Cre recombinase; Ctr, control; DIV, days in vitro; EGFP, enhanced green fluorescent protein; HA, hemagglutinin; HEK293T, human embryonic kidney cells; LV, lentivirus; NGL-3, Netrin-G Ligand 3; Nrxn, neurexin; NS, nonsignificant; SorCS1, Sortilin-related CNS expressed 1; TKD, triple knock down; WT, wild type.

