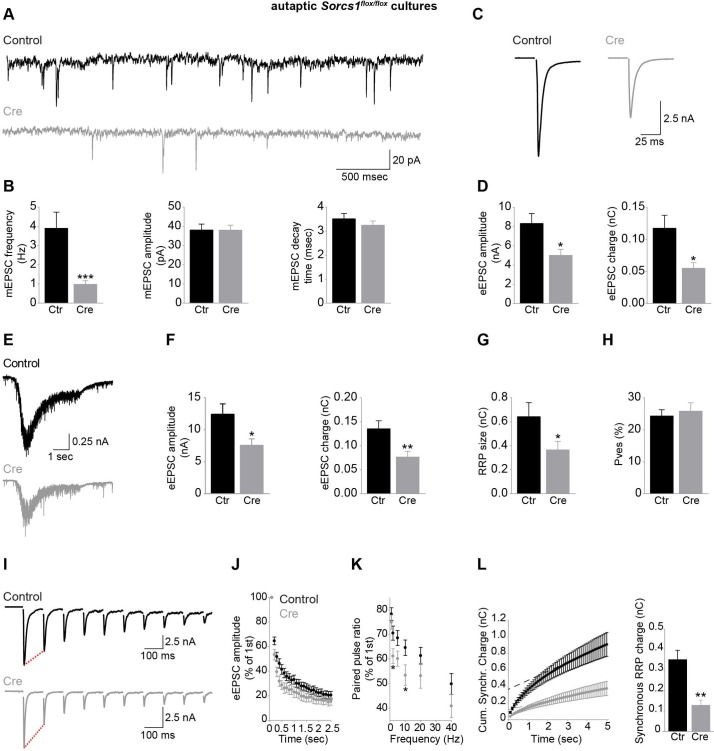
Fig 5. SorCS1 is required for presynaptic function.
(A) Example traces of mEPSCs recorded from DIV14 to DIV16 Sorcs1flox/flox autaptic cortical neurons electroporated with EGFP (Control) or Cre-EGFP (Cre). (B) mEPSC frequency, but not amplitude and decay time, is decreased in Sorcs1 KO neurons. Control (n = 18 neurons); Cre (n = 15). ***P < 0.001 (Mann-Whitney test, 3 independent experiments). (C) Example traces of eEPSCs recorded from DIV14 to DIV16 Sorcs1flox/flox autaptic cortical neurons electroporated with EGFP or Cre-EGFP. (D) eEPSC amplitude and eEPSC charge are decreased in Sorcs1 KO neurons. Control (n = 17 neurons); Cre (n = 14). *P < 0.05 (Mann-Whitney test, 3 independent experiments). (E) Example traces of sucrose responses recorded from DIV14 Sorcs1flox/flox autaptic cortical neurons electroporated with EGFP or Cre-EGFP. (F–H) Decreased eEPSC amplitude, eEPSC charge (F) and RRP size (G) in Sorcs1 KO neurons, but unaltered Pves (H). Control (n = 17 neurons); Cre (n = 21). *P < 0.05; **P < 0.01 (Mann-Whitney test, 3 independent experiments). (I) Example traces of train stimulations (10 Hz) recorded from DIV14 to DIV16 Sorcs1flox/flox autaptic cortical neurons electroporated with EGFP or Cre. (J) Increased depression during 10 Hz stimulation in Sorcs1 KO neurons. Control (n = 18 neurons); Cre (n = 13); 3 independent experiments. (K) Increased paired-pulse depression in Sorcs1 KO neurons throughout different interstimulation intervals. Control (n = 18 neurons); Cre (n = 14). *P < 0.05 (two-tailed t test, 3 independent experiments). (L) Estimation of the RRP size used during neuronal activity by back-extrapolating a linear fit of the steady state current towards the ordinate axis intercept, which represents the initial RRP size before train stimulations (10 Hz). RRP size of active synapses was reduced in DIV14 to DIV16 Sorcs1 KO neurons. Control (n = 18 neurons); Cre (n = 13). **P < 0.01 (Mann-Whitney test, 3 independent experiments). Underlying numerical values can be found in S1 Data. Graphs show mean ± SEM. Cre, Cre recombinase; DIV, days in vitro; eEPSC, evoked excitatory postsynaptic current; EGFP, enhanced green fluorescent protein; KO, knock out; mEPSC, miniature excitatory postsynaptic current; RRP, readily releasable pool; SorCS1, Sortilin-related CNS expressed 1.

