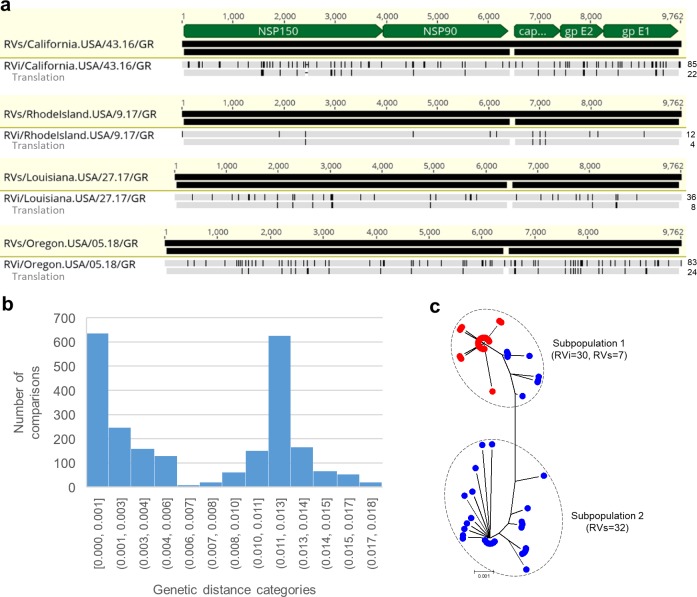
Fig 3. iVDRV quasispecies in tissue and viral isolate.
a. Nucleotide and amino acid substitutions in consensus RVi sequences relative to paired consensus RVs sequences shown by vertical lines for each case. The reference RVs sequences are indicated by light yellow shading. The number of substitutions are shown for each RVi on the right. The regions in the genomic sequence which encode proteins are indicated by the green pointed bars. b. Distribution of pairwise genetic distances between individual quasispecies within primary granuloma sample and the virus isolate from the CA patient. Each bar in the binned histogram represents the number of comparisons in each distance class. Note, the distance categories are not identical due to rounding. Underlying data can be found in the S4 Data file. c. Neighbor-joining tree (non-rooted) for quasispecies within the granuloma sample (n = 39, blue circles) and virus isolate (n = 30, red circles) from the CA case. The genetic distances were computed using the Maximum Composite Likelihood method. The scale bar indicates the number of base substitutions per site.

