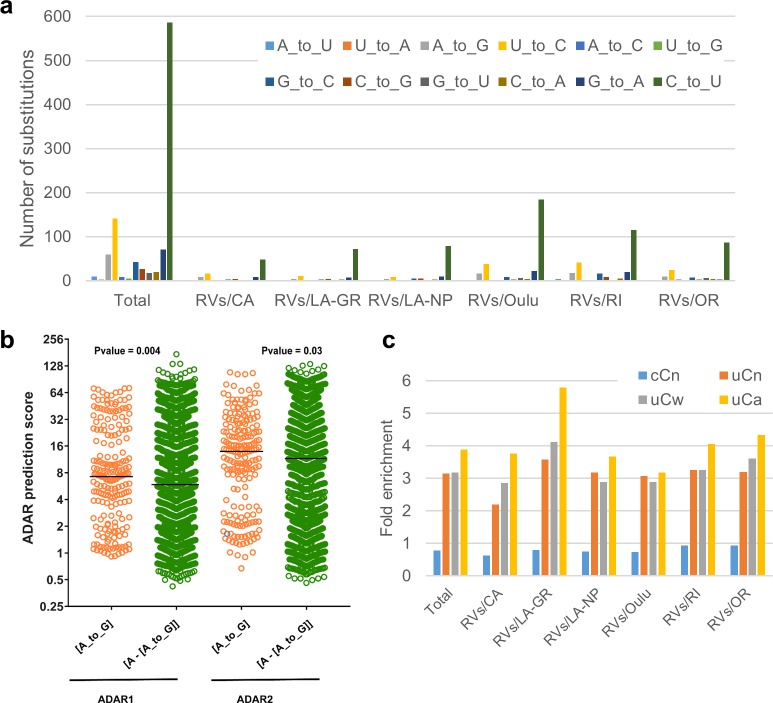
Fig 6. RNA editing signatures in iVDRVs.
a. Spectra of single-nucleotide substitutions in iVDRV RVs genomes. Underlying data for Fig 6A–6C can be found in the S6 Data file. b. ADAR1 and ADAR2 prediction scores for adenines. The scores were calculated for 60 [A to_G] mutations in the positive strand and for 141 [A_to_G] mutations in the negative strand of the viral genome, as well as for the adenines that mutated to bases other than guanines along with adenines that did not mutate at all ([A–[A_to_G]]) (Note: Since, by convention, all mutations in S6 Data file are listed as changes in the positive strand, the negative strand [A to G] mutations are presented in this Table as [U to C] changes in the positive strand). The y axis denotes the prediction scores of hADAR1 and hADAR2 activity expressed as log2. The black horizontal line in the graphs denotes the median value of the prediction scores. P-values are shown above the scatter plots. c. Enrichments with APOBEC editing motifs in iVDRV RVs genomes. Mutated nucleotides are shown in capital letters within trinucleotide mutation motifs. Enrichment values were calculated for C to U mutations induced in the RV positive strand as described in Methods. P-values of one-sided Fisher’s exact test calculated as described in [37] can be found in the tab “Fisher_test_Fig6C” of S6 Data file.

