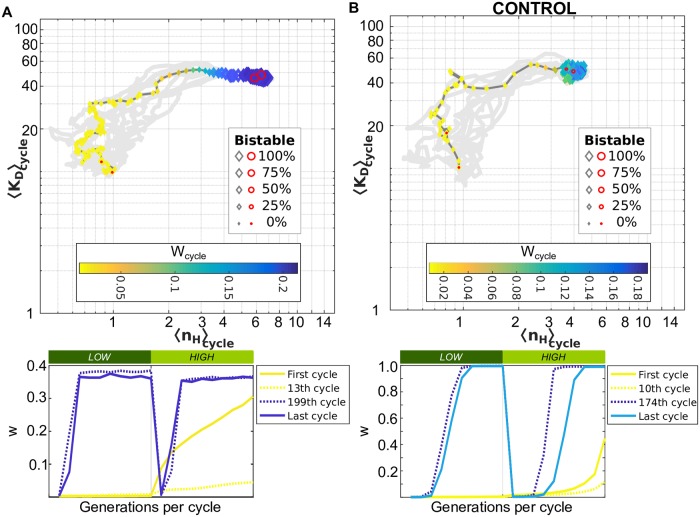
Fig 3. Evolutionary trajectory of a population adapting to a fast fluctuating environment displays selection for high nonlinearity.
The initial population started from a non-optimal genotype (θ0) where k = 80, nH = 1, KD = 10 with evolutionary parameters N = 10000, ν = 0.1, st = 40, u = 0.03, and M = 1.1 both under (A) the original model and (B) in the absence of biochemical noise (CONTROL). The average KD (〈KD〉cycle) versus the average Hill coefficient (〈nH〉cycle) are shown for each environmental cycle simulated, colored given the geometric mean of the population fitness per environmental cycle (), and the marker size corresponds to the average percentage of bistable genotypes in the population (see legend). The traces of other nine replicas are shown in gray as a reference. Each cycle spans a LOW (dark green) and HIGH (light green) epoch and there are 500 environmental cycles over 10,000 generations for each of these simulations. The population fitness w per generation for the first and last cycles, as well as the cycle with the minimum and maximum Wcycle are shown in the bottom for comparison, and colored according to their Wcycle value. In both simulations (A-B), the population evolved to higher nonlinearity values 〈nH〉cycle and Wcycle.

