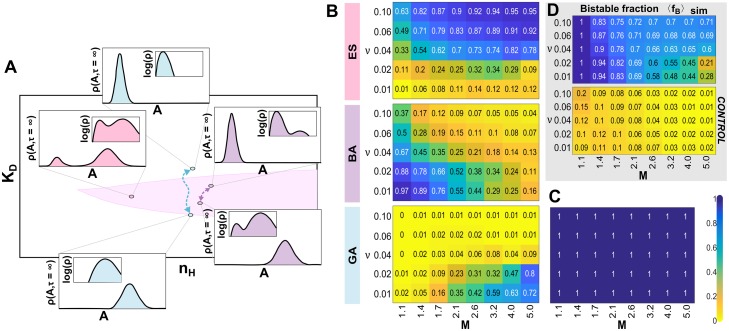
Fig 6. Each adaptation strategy is favored under different evolutionary conditions and the transition between selected strategies is gradual.
(A) Illustration of epigenetic switching (ES), bistable adaptation (BA), and genetic adaptation (GA) strategies and underlying genotypes with fixed synthesis rate (k = 80). The bistable region of genotypic space is highlighted in pink. The phenotype stationary distribution ρ(A, τ = ∞) for each genotype (θ) is shown in the inset, both in linear and logarithmic scale. BA is bistable, as seen in logarithmic scale, but appears effectively monostable in linear scale. This arises because KD evolves each epoch to favor one mode over the other by decreasing the relative rates of epigenetic switching between the largest and smallest mode. (B) Each colormap shows the fraction of parental lineages using specific adaptation strategy (ES, BA, or GA) averaged over all cycles and ten independent replica simulations for the corresponding mutation step-size (M) and environmental fluctuation frequency (ν). Each simulation ran for 10,000 generations with evolutionary parameters N = 10000, st = 40, u = 0.03 and k = 80, nH = 6 and KD = 45 as the initial genotype (θ1). (C) Results of the CONTROL simulations where gene expression dynamics are deterministic and no stochastic epigenetic switching can occur. All lineages exhibited GA and neither bistable strategy (ES or BA) was ever selected. (D) The corresponding bistable fraction (〈fB〉sim) averaged over all cycles and ten independent replica simulations for the stochastic simulations (top) and deterministic CONTROL (bottom; same simulations than B-C, respectively).

