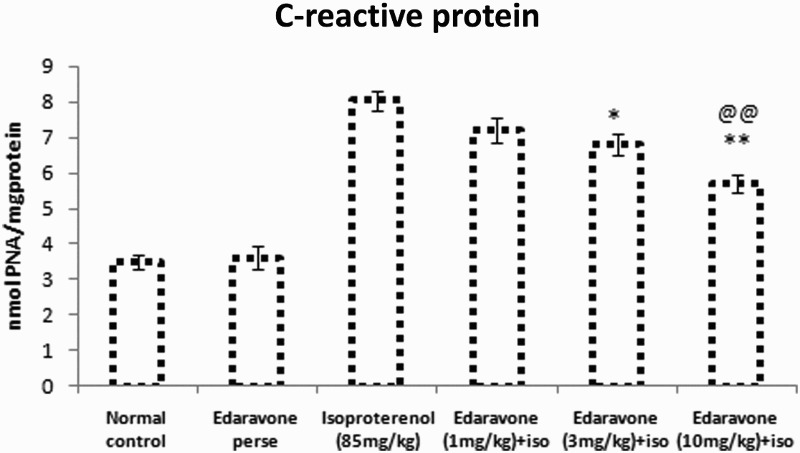
Figure 2.

C-reactive protein in serum of experimental groups. Values are mean ± SEM from a group of six animals. ##P < 0.01 when control group compared with toxic group. *P < 0.05, **P < 0.01, when pretreated group compared with toxic group. @@P < 0.01, when high dose pretreated group compared with low dose pretreated group.
