
Figure 3.
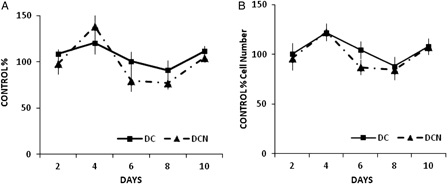
NAC effect on cell viability during adipogenic differentiation. Comparison of MDI cells (DCs) and MDI + 10 µmol/l NAC-treated cells (DCN). Cells were harvested at indicated times. (A) MTT assay was performed, control cells (CCs) absorbance was considered as 100%. (B) Cell were counted, and viable cells were evaluated by trypan blue stain exclusion, control cells (CCs) number was considered as 100%. Data are presented as percentages of control cells. The results are the average of four different experiments (mean ± SD).