
Figure 4.
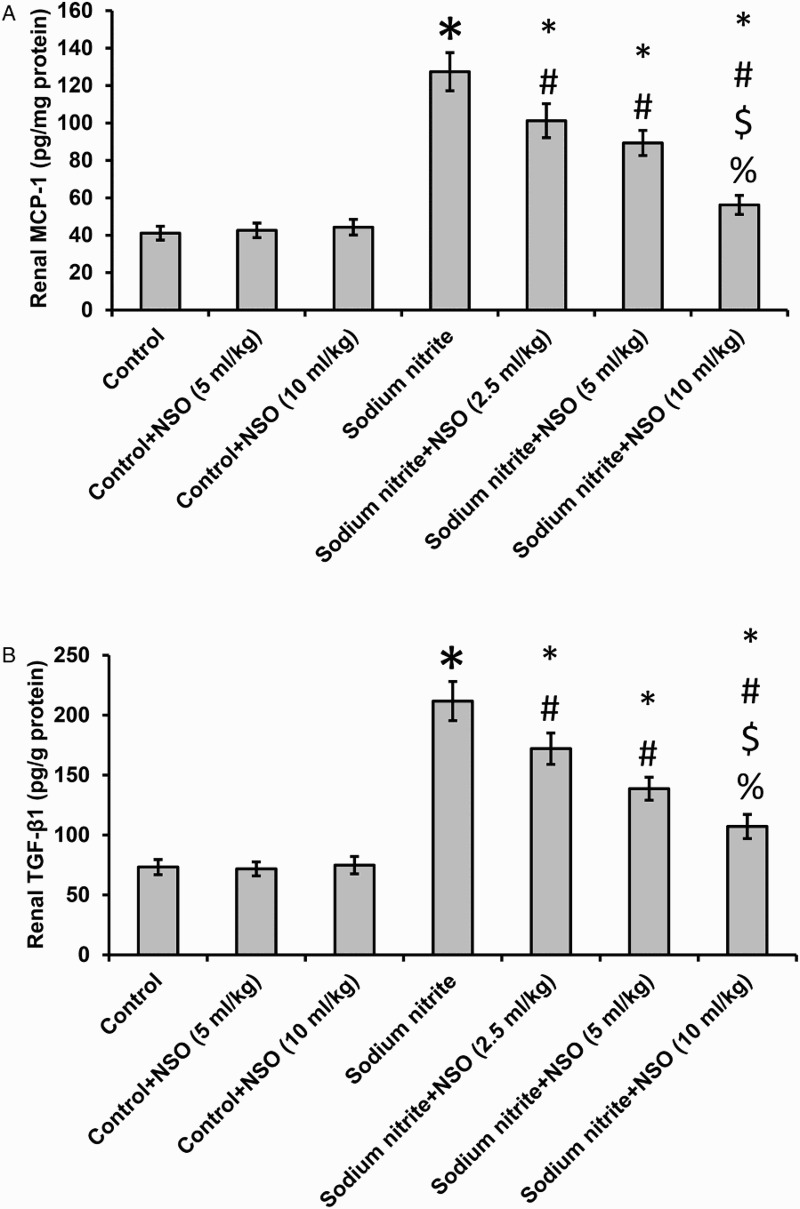
Effect of sodium nitrite (80 mg/kg/day) alone and its combination with NSO (2.5, 5, and 10 ml/kg/day) for 12 weeks on renal tissues levels of MCP-1 (A) and TGF-beta1 (B) levels. *Significant difference when compared with the control groups at P < 0.05. #Significant difference when compared with sodium nitrite groups at P < 0.05. $Significant difference when compared with NSO (2.5 ml/kg) group at P< 0.05. %Significant difference when compared with NSO (5 ml/kg) group at P < 0.05.