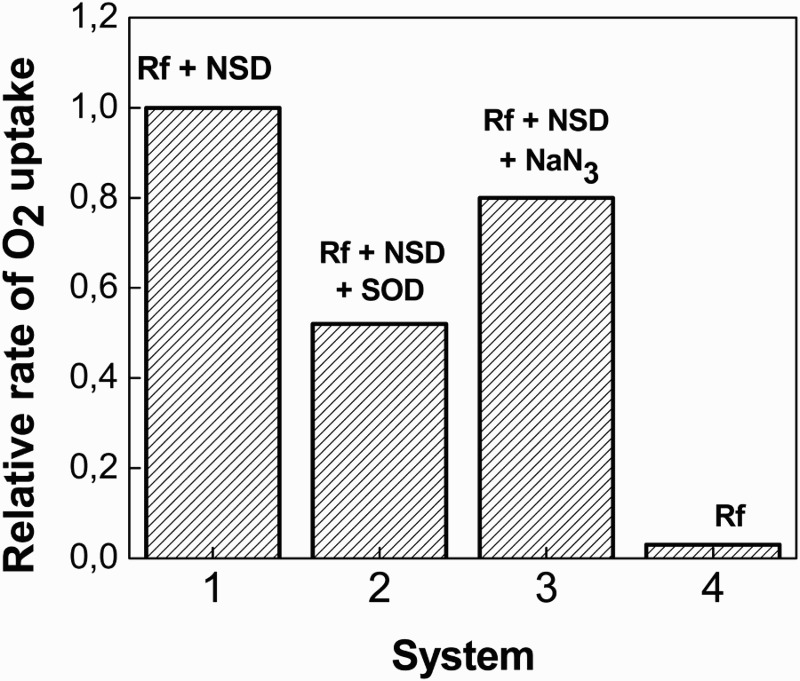
Figure 3.

Bar diagram for the relative rates of oxygen uptake for 0.5 mM NSD + Riboflavin (A445 = 0.4) as a function of photoirradiation time in MeOH, in the absence (1) and in the presence of 1 μg/ml SOD (2); and 1 mM NaN3 (3). Bar (4) corresponds to the relative rate for riboflavin (A445 = 0.4) in MeOH.
