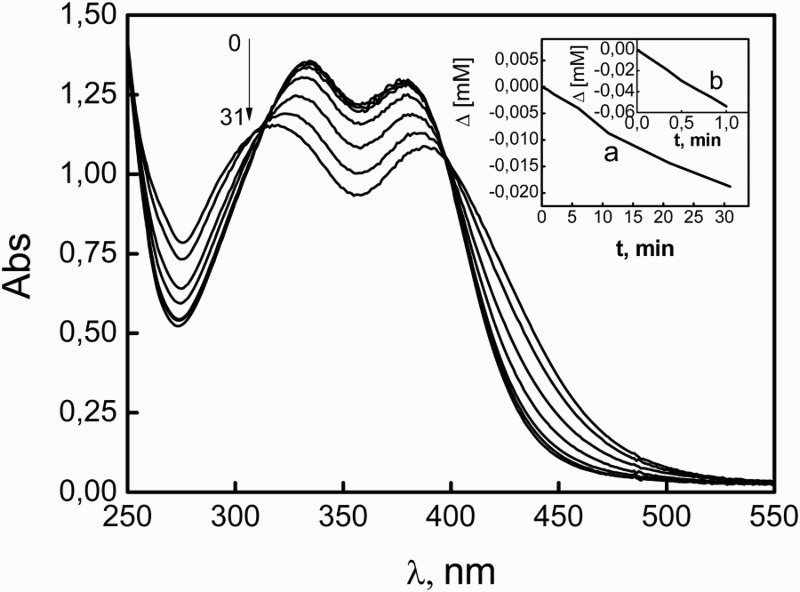
Figure 7.

Evolution of the absorption spectrum of 0.08 mM NSD in MeOH plus 50 mM NaOH upon photolysis at 254 nm. Numbers on the spectra represent irradiation time, in minutes. Inset (a): molar consumption as a function of irradiation time for 0.08 mM NSD in MeOH plus 50 mM NaOH monitored at 380 nm. Inset (b): molar consumption as a function of irradiation time for 0.16 mM BXN in H2O (the actinometer) monitored at 285 nm.
