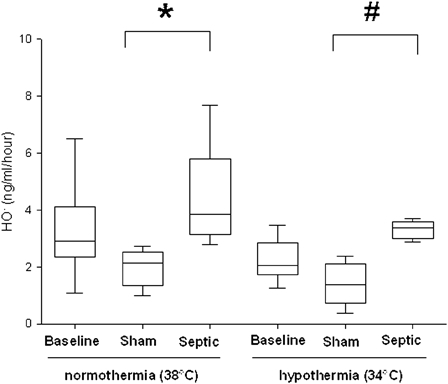
Figure 4.

Hydroxyl radical (HO•) production in plasma per hour for each experimental condition (n = 6 for each group except for sham and septic groups in normothermia where n = 5 and n = 4, respectively). Data are expressed as median ± interquartile range *Significant difference between septic and sham normothermia groups. #Significant difference between septic and sham hypothermia groups (P < 0.05).
