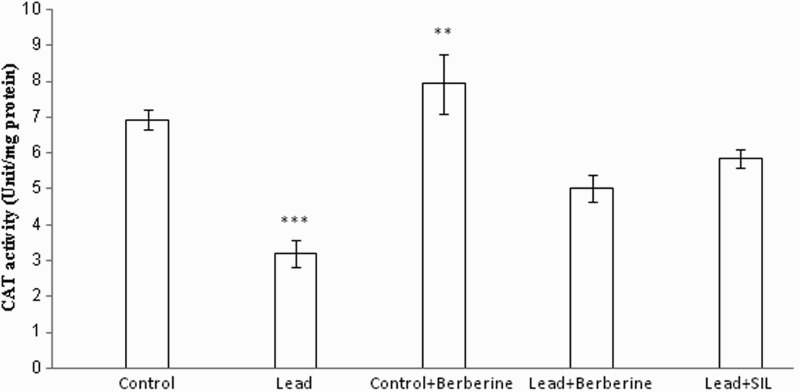
Figure 5.

Effects of long-term berberine administration on CAT activity in liver homogenates samples of control, lead, berberine (50 mg/kg) treated control (Control + Berberine), berberine (50 mg/kg) treated lead (Lead + Berberine), and silymarin (200 mg/kg) treated lead (Lead + SIL) groups (n = 7) at 8 weeks after treatments. The data are represented as mean ± SEM. **P < 0.01 and ***P < 0.001 (as compared to control group).
