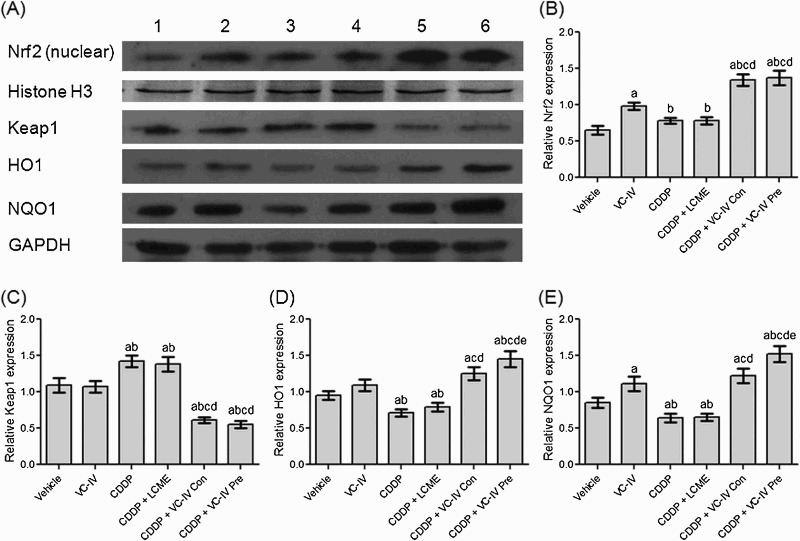
Figure 5.

VC-IV induced Nrf2-mediated activation of ARE pathway. (a) Expression profile of Nrf2 (nuclear), Histone H3, Keap1, HO1, NQO1 and GAPDH in mice kidneys following different treatments. Lane 1: Vehicle-treated group, lane 2: VC-IV-treated group, lane 3: CDDP-treated group, lane 4: CDDP + LCME-treated group, lane 5: CDDP + VC-IV concomitant-treatment group, and lane 6: CDDP + VC-IV pre-treatment group. The bar diagrams showed relative band intensity of (b) Nrf2 (nuclear), (c) Keap1, (d) HO1, and (e) NQO1. The results were normalized with Histone H3 for Nrf2 and GAPDH for Keap1, HO1, and NQO1. Data were represented as mean ± S.D, n = 4. asignificantly (P < 0.05) different from vehicle-treated group, bsignificantly (P < 0.05) different from VC-IV-treated group, csignificantly (P < 0.05) different from CDDP-treated group, dsignificantly (P < 0.05) different from CDDP + LCME-treated group, and esignificantly (P < 0.05) different from CDDP + VC-IV concomitant-treatment group.
