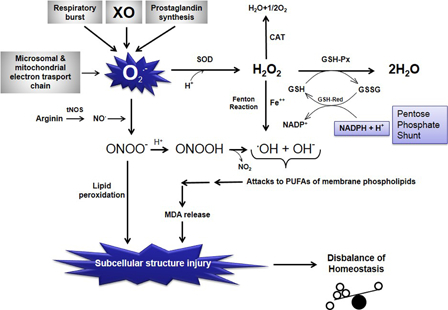
Figure 1.

Schematic representation of the relationships among free oxygen radical formation, enzymatic antioxidant systems, and lipid peroxidation. O2−, superoxide anion radical; O2, molecular oxygen; H+, hydrogen ion, proton; H2O, water; SOD, superoxide dismutase; CAT, catalase; H2O2, hydrogen peroxide; GSH-Px, glutathione reductase; GSH, reduced glutathione; GSSG, oxidized glutathione; GSH-Red, glutathione reductase; NADPH + H+, reduced nicotinamide adenine dinucleotide phosphate; NADP+, oxidized nicotinamide adenine dinucleotide phosphate; Fe++, ferrous iron; OH−, hydroxyl ion; .OH, hydroxyl radical (the most potent free radical); tNOS, total nitric oxide synthases (neuronal NOS, endothelial NOS, and inducible NOS); NO., nitric oxide radical; ONOO−, peroxynitrite; MDA, malondialdehyde (the last product of lipid peroxidation of membrane phospholipids); NO2, nitrite; PUFA, polyunsaturated fatty acid; XO, xanthine oxidase.
