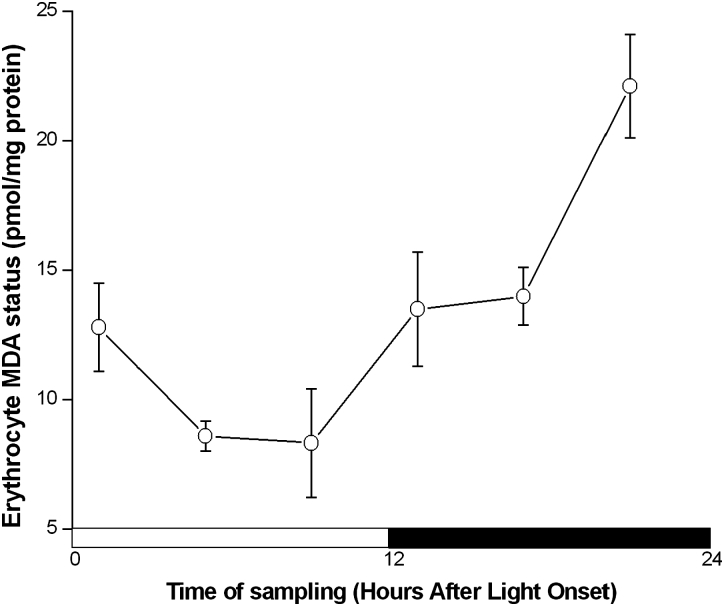
Figure 1.
Circadian variation of erythrocyte MDA status (pmol/mg protein) in normal male mice. The curve represents the chronogram drawn from data (mean ± SEM) of six circadian time stages (1, 5, 9, 13, 17, and 21 HALO). Each timepoint value is the mean ± SEM of 10 independent values. The black bar corresponds to the dark period. MDA value was higher at the end of the activity (≅21 HALO) compared to the end of the rest span (≅9 HALO). One-way ANOVA further validated a statistically significant difference according to the sampling time (F = 6.7, P < 0.0001). A circadian (τ ≅ 24 hours) rhythm was confirmed by Cosinor analysis with correction for multiple testing (P < 0.02).

