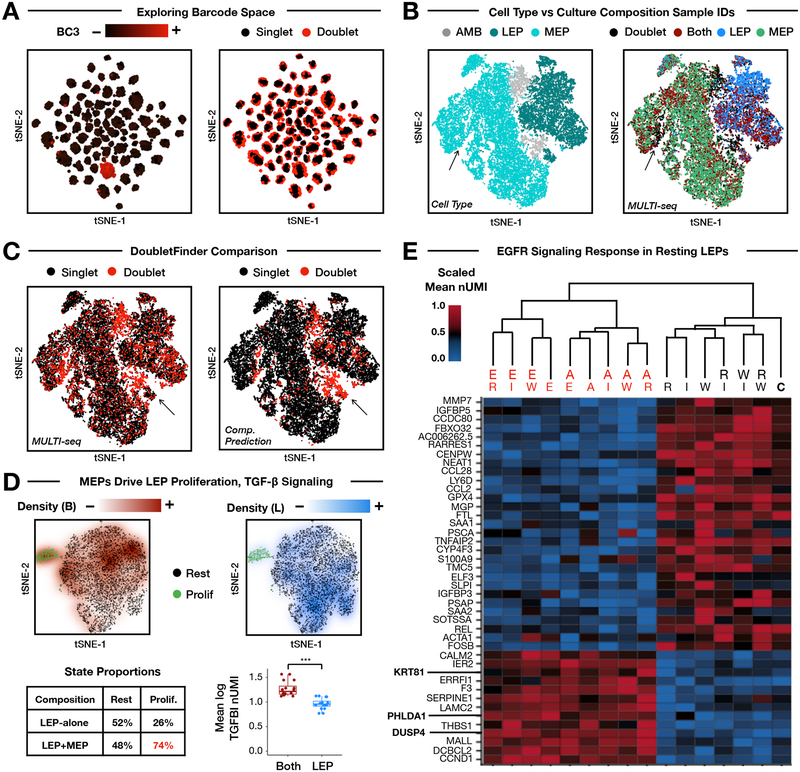
Figure 2: MULTI-seq barcoding of multiplexed HMEC culture conditions.
(A) Barcode UMI abundances (left) and doublet classifications (right) mapped onto barcode space. MULTI-seq barcode #3 is used as a representative example. Doublets localize to the peripheries of sample groups in large-scale sample multiplexing experiments. n = 25,166 cells.
(B) Cell state annotations demonstrate separation between MEPs (cyan) and LEPs (dark teal) in gene expression space (left, see Fig. S5A). Ambiguous cells positive for multiple marker genes are displayed in grey. MULTI-seq classifications grouped by culture composition (right) — e.g., LEP-alone (blue), MEP-alone (green), and both cell types together (dark red) — match cell state annotations. Discordant region where annotated MEPs are classified as doublets by MULTI-seq is indicated with arrows. n = 25,166 cells.
(C) MULTI-seq doublet classifications (left) and computational predictions produced by DoubletFinder (right) largely overlap in gene expression space. Discordant region where DoubletFinder-defined doublets that are classified as singlets by MULTI-seq indicated with arrows. n = 25,166 cells.
(D) MEP co-culture induces LEP proliferation and TGF-β signaling. Clusters corresponding to resting (black) and proliferative (green) LEPs are identifiable in gene expression space (Fig. S5B). Projecting sample classification densities onto gene expression space for co-cultured LEPs (dark red, top left) and LEPs cultured alone (blue, top right) illustrates that co-cultured LEPs are enriched in the proliferative state (table, bottom left). Co-cultured LEPs also express more TGFBI than LEPs cultured alone. Each point represents an average of LEPs grouped according growth factor condition. *** = Wilcoxon rank sum test (two-sided), p = 3.1×10⁻⁶. n = 32 signaling molecule condition groups. Data are represented as mean ± SEM.
(E) Hierarchical clustering and heat map analysis of resting LEPs grouped by treatment. Emphasized genes are known EGFR signaling targets. RNA UMI abundances are scaled from 0–1 for each gene. Values correspond to the average expression within each signaling molecule treatment group. Dendrogram labels: E = EGF, W = WNT4, A = AREG, I = IGF-1, R = RANKL, C = Control.

