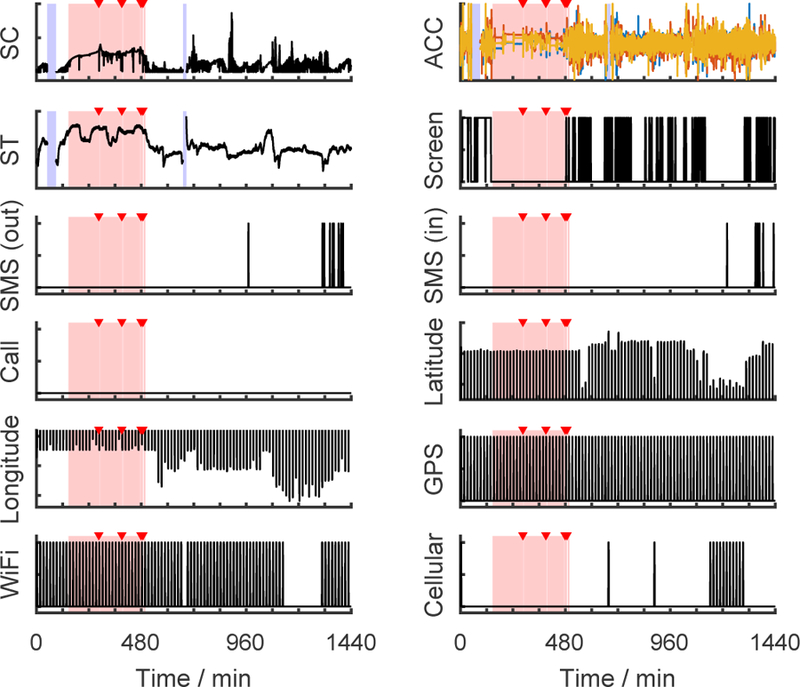
Fig. 1.

Raw data streams from an exemplary day. The pink bars mark sleep epochs and the red triangles indicate waking up during the night as determined from actigraphy and sleep diary. The blue bars denote missing data. (SC = skin conductance, ACC = accelerations of three axes, ST = skin temperature)
