. 2019 Oct 18;8:e49065. doi: 10.7554/eLife.49065

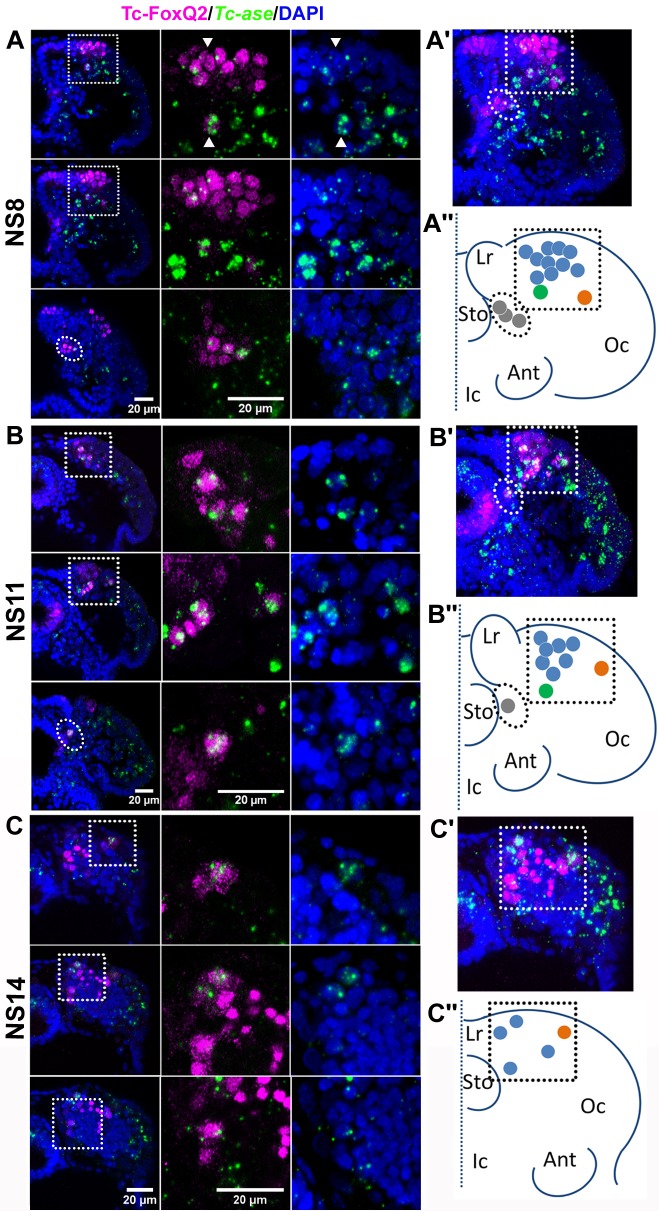
Figure 1. Tc-FoxQ2 positive neural progenitor cells.

Tc-FoxQ2 protein is visualized by immunohistochemistry at different stages (magenta) while neural progenitor cells (NPCs) are marked by intronic Tc-asense whole mount in situ hybridization (green). Nuclei are visualized by DAPI (blue). Optical sections of right halves of stained heads are shown in the left column while respective close-ups are shown in second and third column (see hatched areas in left column in (A, B and C). A projection of all optical sections is given in the right column (A’, B’ and C’). The schemes represent the outline of right halves of the head lobes of flattened embryos. The dotted line represents the midline. This depiction is comparable to the one previously used for Drosophila neuroblast maps (Urbach and Technau, 2003a) (A’’, B’’ and C’’). (A–A’’) At NS8 about 15 Tc-FoxQ2 positive NPCs are found (n = 6). By position, three groups are distinguished: A large anterior median group (blue in A’’) with one neuroblast slightly separated posteriorly (green in A’’), one single lateral NPC (orange in A’’) and a group located closely to the midline (gray in A’’). White arrowheads show two exemplary NPCs. (B–B’’) At NS11 about 10 Tc-FoxQ2 positive NPCs are observed (n = 6). (C–C’’) At NS14, the number has decreased to 5–7 cells (n = 6). The single lateral NPC remains distinguishable (orange in C’’). Lr: labrum; Sto: stomodeum; Oc: ocular region; Ant: antenna; Ic: Intercalary region.

Figure 1.

Figure 1—figure supplement 1. Generation of a Tc-FoxQ2 antibody.
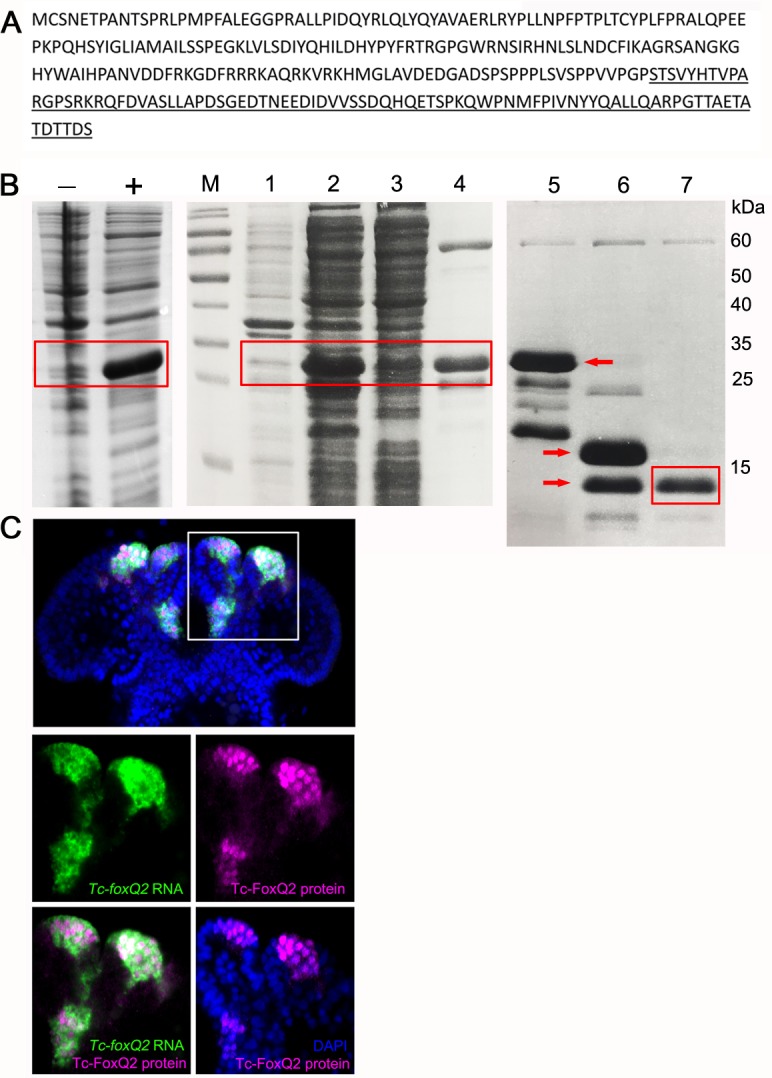
Figure 1—figure supplement 1.

(A) Protein sequence of Tc-FoxQ2. The C-terminus containing 85 amino acids (underlined) has little homology to other proteins in Tribolium and was used for protein expression. (B) Coomassie-blue stained SDS-PAGE gel analysis of expression and purification of Tc-FoxQ2. (-) Before IPTG induction; (+) after IPTG induction. M, marker; lane 1, cell pellet; lane 2, supernatant; lane 3, flow through after Ni2+ chelate affinity chromatography; lane 4, eluted fractions by imidazole; lane 5, before SUMO protease digestion (red arrow); lane 6, after SUMO protease digestion, two bands are observed (red arrows): 6xHis-SUMO and Tc-FoxQ2; lane 7, flow through after re-Ni2+ chelate affinity chromatography which contains Tc-FoxQ2. (C) Expression of Tc-foxQ2 RNA (green) and Tc-FoxQ2 protein (magenta) in the embryo. Tc-foxQ2 RNA is detected throughout the cytoplasm, while Tc-FoxQ2 protein is detected in the nuclei (blue). Tc-foxQ2 RNA and Tc-FoxQ2 protein show a high overlap.
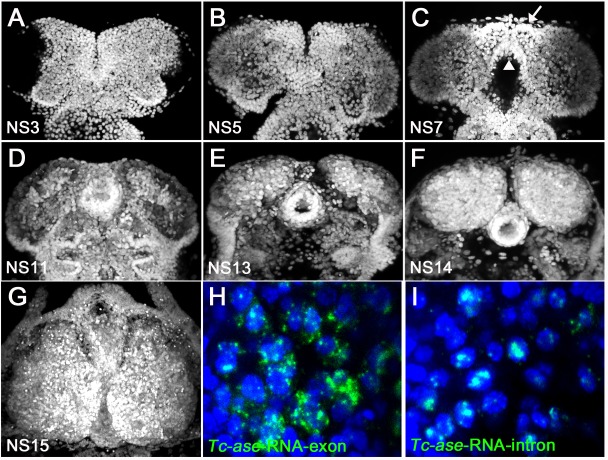
Figure 1—figure supplement 2. Developmental staging and comparison of exonic versus intronic Tc-asense probes.

Figure 1—figure supplement 2.

In Tribolium, the established morphological staging system (Biffar and Stollewerk, 2014) with respect to early neurogenesis has 15 stages, termed NS1 to NS15. (A, B) From NS3 to NS5, the neuroectoderm is still a flat sheet of cells. (C) At NS7, the labral and stomodeal buds have formed (arrow, white arrowhead). (D) At NS11, the brain grows thicker and contains an increased number of cells. (E, F) From NS13 onwards, the brain hemispheres become an oval shape and grow. (G) At NS15, the brain hemisphere shows a pear-like shape. All planes are dorsal view. (H) Tc-ase-RNA exonic probe marks cytoplasm. (I) Tc-ase-RNA intronic probe marks only nuclei, which allows cell identification.