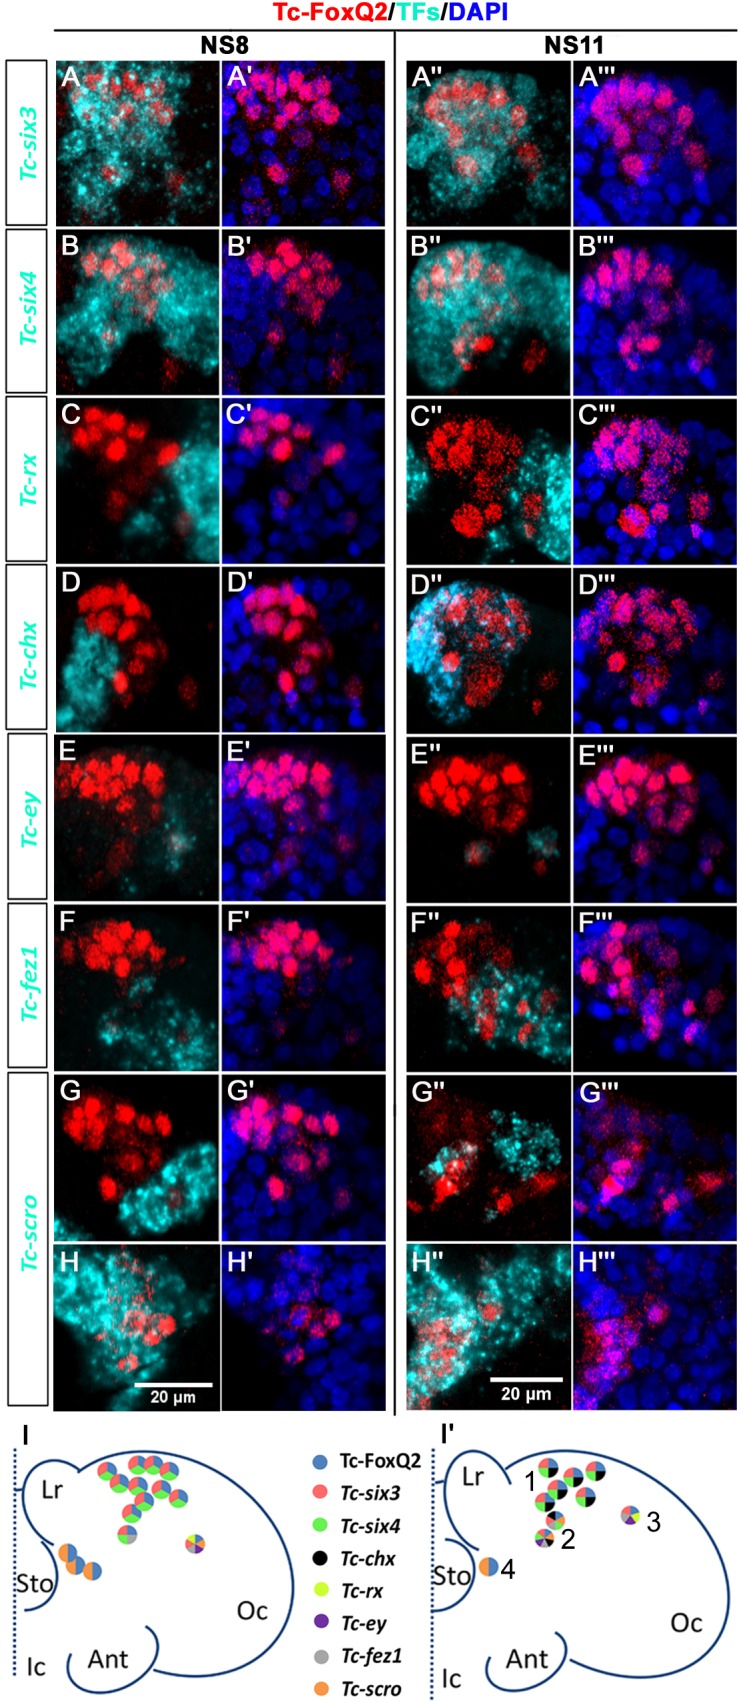
Figure 2. Neural progenitor cells co-express transcription factors.

Tc-FoxQ2 is visualized by immunohistochemistry (red) while the other transcription factors (TFs) are marked by fluorescent in situ hybridization (cyan) at NS8 and NS11. Nuclei are visualized by DAPI (blue). Close-ups of the right halves of embryonic heads are shown (A–H’’’) and schemes are given at the bottom (I and I’). (A–A’’’) Co-expression of Tc-six3 and Tc-FoxQ2. (B–B’’’) Co-expression of Tc-six4 and Tc-FoxQ2. (C–C’’’) Co-expression of Tc-rx and Tc-FoxQ2. (D–D’’’) Co-expression of Tc-chx and Tc-FoxQ2. (E–E’’’) Co-expression of Tc-ey and Tc-FoxQ2. (F–F’’’) Co-expression of Tc-fez1 and Tc-FoxQ2. (G–H’’’) Co-expression of Tc-scro and Tc-FoxQ2. (I, I’) Four different identities of NPCs are distinguished based on their position and co-expression. P-fox-am (1) is located in the anterior median neuroectoderm. The cells in this group co-express Tc-FoxQ2 with Tc-six3, Tc-six4 and later Tc-chx. P-fox-amp (2) is located posteriorly adjacent with additional expression of Tc-scro, Tc-fez1 and in one of the cells also Tc-ey. P-fox-l (3) consists of one lateral cell which co-expresses Tc-FoxQ2 with Tc-six3, Tc-fez1, Tc-rx and Tc-ey. P-fox-v (4) is located ventrally adjacent to the stomodeum, showing only co-expression of Tc-FoxQ2 and Tc-scro. Same abbreviations as in Figure 1.
