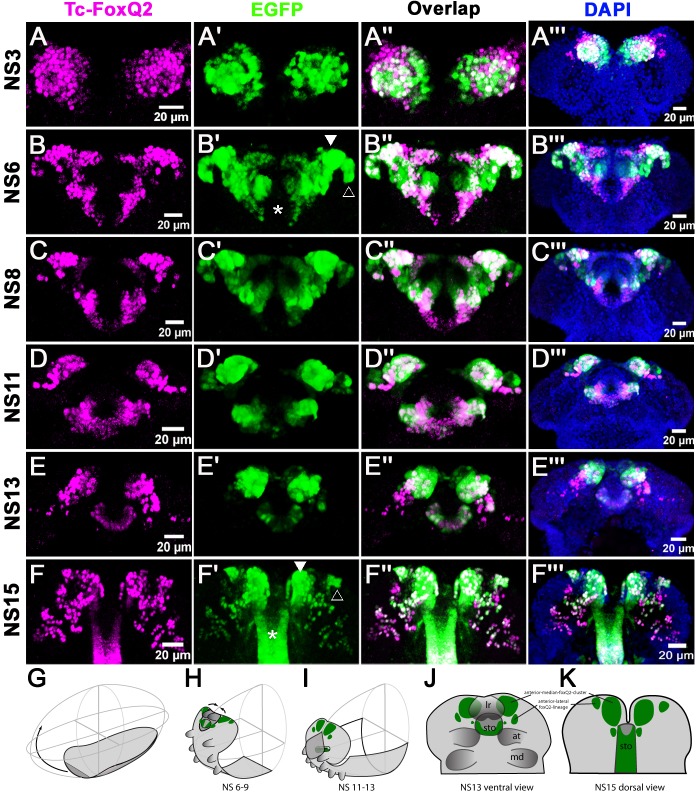
Figure 3. Tc-foxQ2 positive cells marked by antibody and the foxQ2-5’-line.
The expression of EGFP (green) derived from the foxQ2-5’-line and Tc-FoxQ2 protein (magenta) correlate closely throughout embryogenesis. The morphology of the anterior neuroectoderm is visualized with DAPI staining (blue, right column). Shown are heads of embryos dissected out of the egg and flattened to reveal the staining within the neuroectoderm (A’’’–C’’’) and the developing brain (D’’’–F’’’). Some differences between EGFP and Tc-FoxQ2 expression are observed, which may be due to either different dynamics of maturation and degradation of these proteins or to divergence of the enhancer trap signal from the endogenous expression. (A–A’’’) At NS3, Tc-foxQ2 expression shows two bilateral domains within the anterior median region. (B–F’’’) Later, the expression domains split into a stomodeal (asterisk), a median (white arrowhead) and lateral domain (open arrowhead). At NS15, two clusters of cells are observed: The large anterior-median-foxQ2-cluster (white arrowhead in F’) and a smaller anterior-lateral-foxQ2-lineage (open arrowhead in F’). (G–I) The general movements of the head tissue areshown from the germ rudiment (G) to an elongating (H) and a retracting stage (I). The approximate positions of the Tc-foxQ2 marked cells underlying the head epidermis are shown. (J,K) Flat preparations of heads of stage NS13 (J) and NS15 (K) are shown with the approximate positions of the underlying Tc-foxQ2 marked cells shown in green. (G–I) are redrawn from Posnien and Bucher (2010).
Figure 3—figure supplement 1. Characterization of the foxQ2-5’-line.


