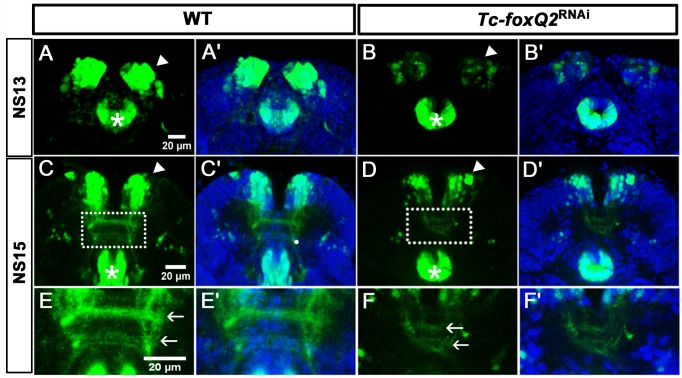
Figure 9. RNAi in the foxQ2-5’-line indicates self-regulation.
(A–B’) At NS13, Tc-foxQ2 RNAi shows the strongly reduced number of marked cells in the anterior-median-foxQ2-cluster (n = 4; white arrowheads) while the signal in the stomodeum appears to be unaffected (stars). (C–F’) In Tc-foxQ2 RNAi, the number of marked cells decreased significantly (n = 4; white arrowhead). The fascicles are reduced and follow an abnormal rounded path instead of the straight line in WT (compare white arrows in E and F). Legends figure supplements.

