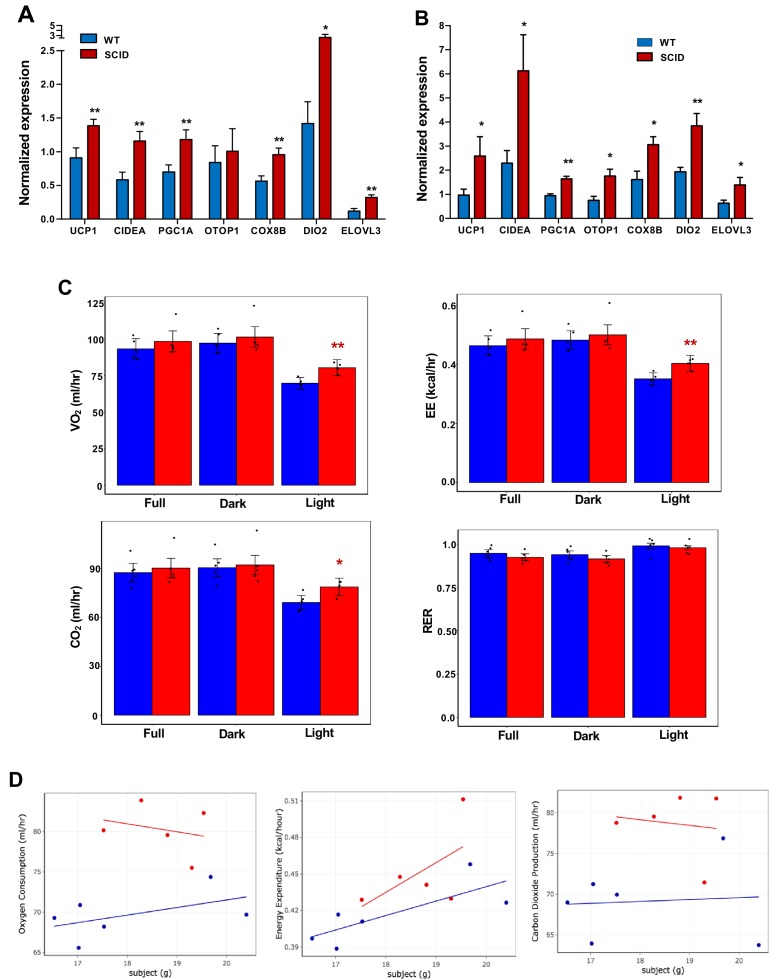
Figure 7. Increased adipose thermogenesis and EE in lymphocyte-deficient mice.
(A and B) Real-time PCR analysis of gene expression in iWAT from chow-fed 10 week 24 hr cold-exposed (A) or CL (1 mg/kg/day for 4 days (B) mice. (C, D) Bar graphs (C) and scatter plot (D) (Light cycle) showing oxygen consumption, energy expenditure, carbon dioxide production, and RER in CL-treated mice with body mass as covariate. N = 6,5. *, p<0.05, **, p<0.01.

