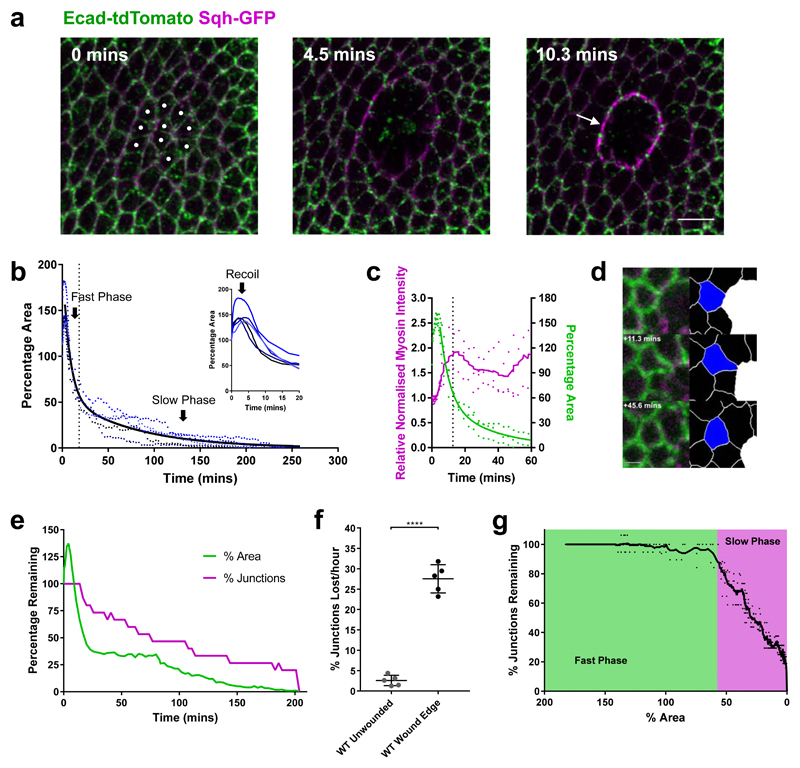
Figure 1. Wing disc wound closure is punctuated by wound edge intercalation, which can drive wound closure.
a, Early stages of wound closure in a sqhAX3; sqh-GFP, Ecad-tdTomato wing imaginal disc. Cell outlines are marked by Ecad-tdTomato (green) and Myosin II by Sqh-GFP (magenta). Cells which will be ablated are marked by white circles at 0 mins. Within the first 10 minutes after wounding, a strong accumulation of Myosin II can be seen at the wound’s edge in the manner of a purse string (arrow). Images are maximum intensity projections of deconvolved image stacks. Scale bar = 5µm. b, Dynamics of wing disc wound closure. Percentage of original wound area is plotted over time for 5 WT wing discs expressing Ecad-GFP (blue dots, the same 5 wing discs are used for all subsequent WT analysis unless otherwise stated). Inset: first 20 mins, showing early expansion (recoil) of the wound. A two-phase exponential decay curve (black line) is fitted to the data after 3 minutes, when the wound begins to reduce in area until close. The transition between fast and slow closure phases of the two-phase exponential decay is marked by a dotted line (18.37 mins). c, Quantification of Myosin II purse string intensity (magenta, left y-axis) and wound percentage area (green, right y-axis) for 3 sqhAX3; sqh-GFP, Ecad-tdTomato wing discs during the first hour of wound closure. A two-phase exponential decay curve has been fitted to the area data (green line) and a moving average (±4 time points) curve to the Myosin II intensity data (magenta line). The transition between fast and slow closure phases is shown with a dotted line (12.71 mins) d, Example of a single wound edge intercalation in an Ecad-GFP; sqh-mCherry, pnr-GAL4 wing disc. Raw maximum intensity projection (left) and skeletonised images (right, intercalating cell in blue, wound in white) are shown. The junction shared between the intercalating cell and the wound shrinks to a point and a new junction grows in the orthogonal direction. Scale bar = 3µm. e, Quantification of the percentage of starting wound edge junctions (magenta) and wound percentage area (green) for a single Ecad-GFP wing disc wound. The percentage of junctions remaining on the wound’s edge reduces as intercalations occur until the wound fully closes. f, Quantification of intercalation rate in unwounded WT tissues and at WT wound edges. The intercalation rate is significantly higher at the wound edge (unpaired t-test with Welch’s correction, n=5, t=15.15, df=5.089, p<0.0001). Error bars = SD. g, Relationship between percentage of wound start area and percentage of starting wound edge junctions remaining. The mean percentage area at which there is a transition between the fast (green) and slow (magenta) closure phases is highlighted (57.6%). A moving average curve (±4 time points) of the data is shown.

