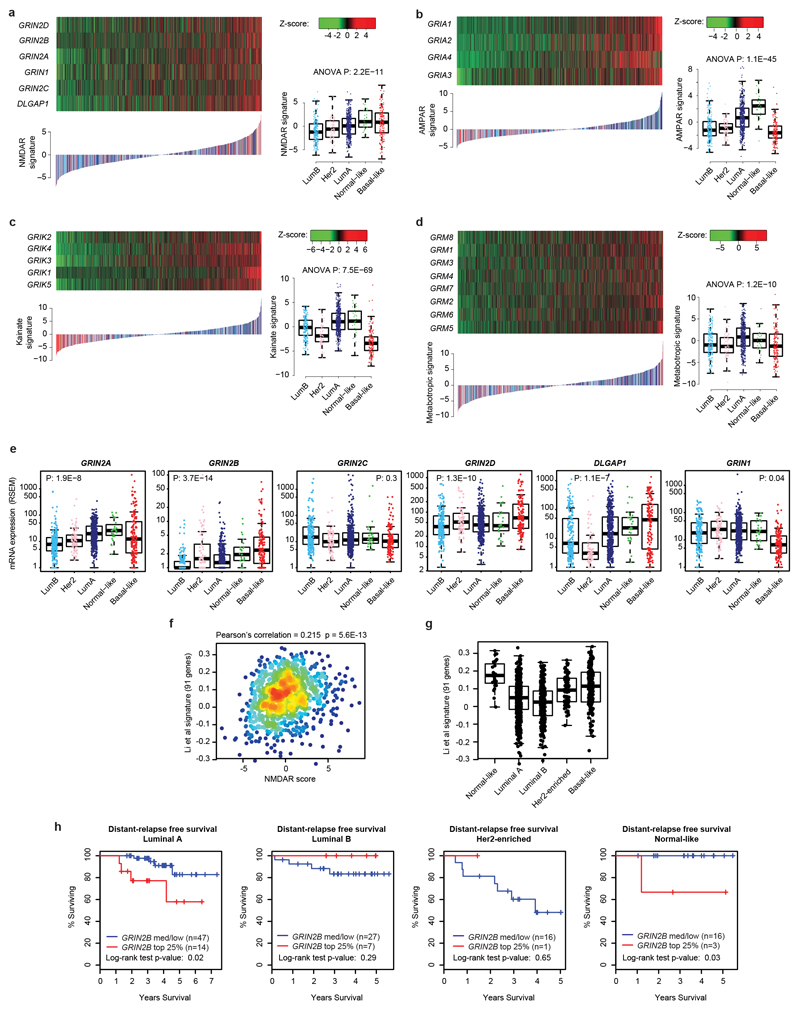
Extended Data Figure 1. Association of the NMDAR signaling pathway with human breast cancer.
a, mRNA expression of 6 NMDAR-associated genes (GRIN2A, GRIN2B, GRIN2C, GRIN2D, GRIN1 and DLGAP1) in 1,100 breast cancer (BC) patients from The Cancer Genome Atlas (TCGA). Samples were sorted by NMDAR score (lower panel), which combines, for each sample, the Z-scores of normalized expression values of all 5 genes.
b, mRNA expression of 4 AMPAR-associated genes (GRIA1, GRIA2, GRIA4 and GRIA3) in 1,100 breast cancer (BC) patients from TCGA. Samples were sorted by AMPAR score (lower panel), which combines, for each sample, the Z-scores of normalized expression values of all 4 genes.
c, mRNA expression of 5 Kainate-associated genes (GRIK2, GRIK4, GRIK3, GRIK1 and GRIK5) in 1,100 breast cancer (BC) patients from TCGA. Samples were sorted by Kainate score (lower panel), which combines, for each sample, the Z-scores of normalized expression values of all 5 genes.
d, mRNA expression of 8 Metabotropic glutamate-associated genes (GRM8, GRM3, GRM4, GRM7, GRM2, GRM6 and GRM5) in 1,100 breast cancer (BC) patients from TCGA. Samples were sorted by Metabotropic score (lower panel), which combines, for each sample, the Z-scores of normalized expression values of all 5 genes.
e, Boxplot comparison of mRNA expression of GRIN2A, GRIN2B, GRIN2C, GRIN2D, DLGAP1 and GRIN1 (from left to right) across the five breast cancer PAM50 subtypes. P-values were computed using a two-sided ANOVA test.
f, Comparison between NMDAR score (X-axis) and a previously derived NMDAR expression signature (Y-axis) across all breast cancer samples. Points are color coded based on points concentration (warm color = high concentration, cold colors = low concentration), n = 1100.
g, Boxplot comparison of scores from the previously derived NMDAR expression signature across the five PAM50 breast cancer subtypes.
h, Kaplan-Meier plots comparing distant-relapse free survival between samples with high GRIN2B expression (top 25%, red line) versus remaining cases (blue line) in Luminal B, Her2-enriched, Luminal B, Normal-like, and Basal-like breast cancer subtypes (from left to right). Log-rank tests are two-sided.
In all comparisons, the number of samples for each breast cancer subtype (panels a-e and g) are: Luminal A (n = 467), Luminal B (n = 198), Her2-enriched (n = 72), Normal-like (n = 28), Basal-like (n = 155). The thick central line of each box plot represents the median number of significant motifs, the bounding box corresponds to the 25th–75thpercentiles, and the whiskers extend up to 1.5 times the interquartile range.

