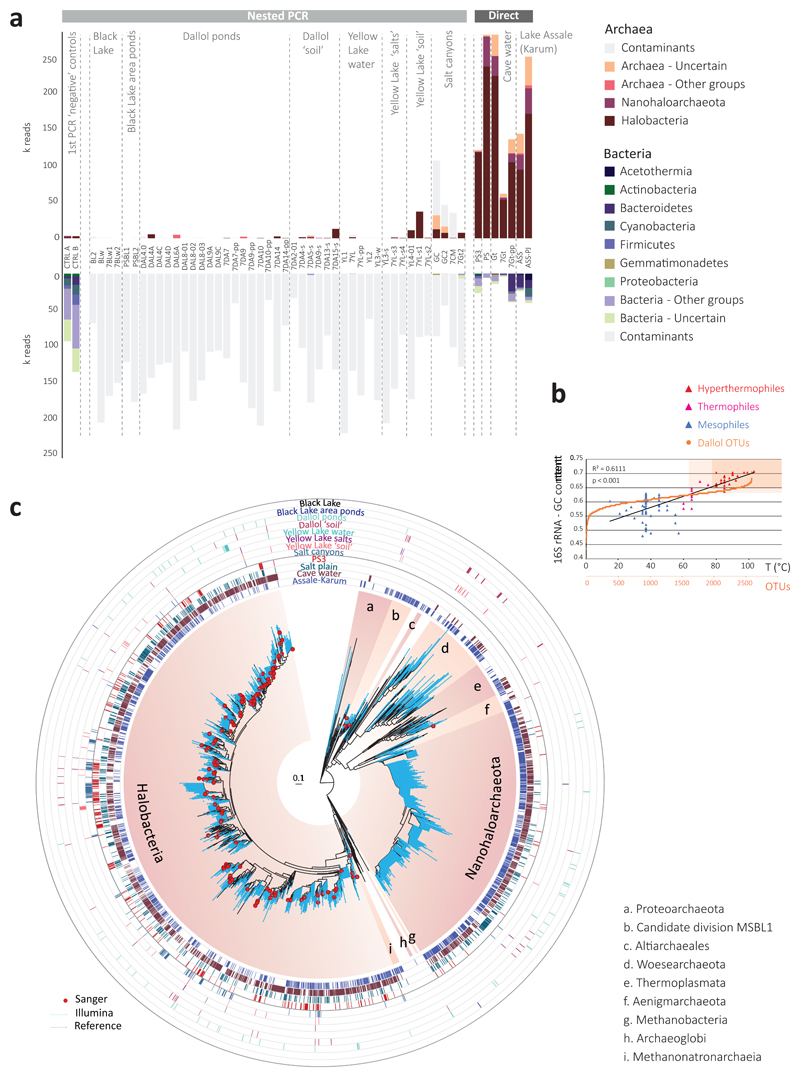
Fig. 3. Distribution and diversity of prokaryotes in samples from the Dallol mound and surrounding areas based on 16S rRNA gene metabarcoding data.
a, histograms showing the presence/absence and abundance of amplicon reads of archaea (upper panel) and bacteria (lower panel) obtained with universal prokaryotic primers. Samples yielding amplicons directly (negative PCR controls were negative) are shown on the right (Direct). Samples for which amplicons were only obtained after nested PCR, all of which also yielded amplicons in ‘negative’ controls, are displayed on the left (Nested PCR). Sequences identified in the ‘negative’ controls, considered as contaminants, are shaded in light grey in the corresponding Dallol samples. The phylogenetic affiliation of dominant archaeal and bacterial groups is color-coded. For details, see Supplementary Table 5. b, GC content of archaeal OTUs plotted on a graph showing the positive correlation of GC content (for the same 16S rRNA region) and growth temperature of diverse described archaeal species. c, phylogenetic tree of archaeal 16S rRNA gene sequences showing the phylogenetic placement of archaeal OTUs identified in the different environmental samples (full tree provided as Supplementary Data 1). Sequences derived from metabarcoding studies are represented with blue branches (Illumina sequences); those derived from cloning and Sanger sequencing of environmental samples, cultures and FACS-sorted cells are labelled with a red dot. Reference sequences are in black. Concentric circles around the tree indicate the presence/absence of the corresponding OTUs in different groups of samples (groups shown in panel a).

