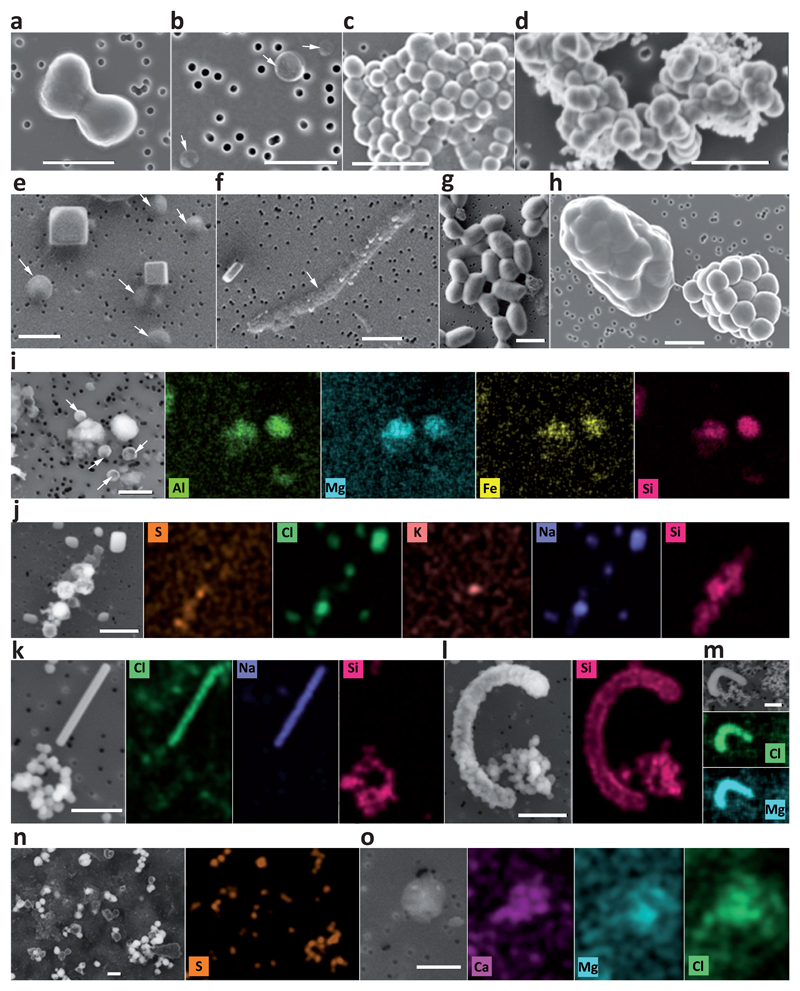
Fig. 4. Scanning electron microscopy (SEM) pictures and chemical maps of cells and abiotic biomorphs identified in samples from the Dallol region.
a-h, SEM pictures of cells (a-c, e-h) and abiotic biomorphs (d). i-o, SEM images and associated chemical maps of cells and biomorphs; color intensity provides semi-quantitative information of the mapped elements. a, FACS-sorted dividing cells from sample PS (hydrated salt pan between the Dallol dome base and the Black Lake); b, FACS-sorted ultrasmall cells from 7Gt samples (cave water reservoir, Dallol canyons); c, FACS-sorted colony of ultrasmall cells from sample PS (note cytoplasmic bridges between cells); d, FACS-sorted abiotic silica biomorphs from the Dallol pond 7DA9 (note the similar shape and morphology as compared to cells in panel c); e, cocci and halite crystals in 8Gt samples (cave water); f, long rod in 8Gt; g, FACS-sorted cells from Gt samples; h, FACS-sorted colonies from sample PS (note the bridge between one naked colony and one colony covered by an exopolymeric-like matrix); i, small cocci and amorphous Al-Mg-Fe-rich silicate minerals from Gt; j, NaCl crystals and S-Si-rich abiotic biomorphs from Dallol pond sample 7DA7; k, NaCl crystal and Si-biomorphs and l, Si-encrusted cell and Si-biomorphs in sample 8Ass (Lake Assale); m, Mg-Cl biomorph in sample BLPS_04 (Black Lake area pond); n, S-rich biomorphs in Dallol pond 7DA9; o, Ca-Mg-Cl biomorph in YL-w2 (Yellow Lake pond). SEM photographs were taken using In Lens or AsB detectors; AsB was used for chemical mapping purposes. For additional images and SEM details, see Supplementary Figs. 1-2. White arrows indicate cells difficult to recognize due to their small size and/or flattened aspect possibly resulting from sample preparation and/or high vacuum conditions within the SEM. The scale bar corresponds to 1 μm.

