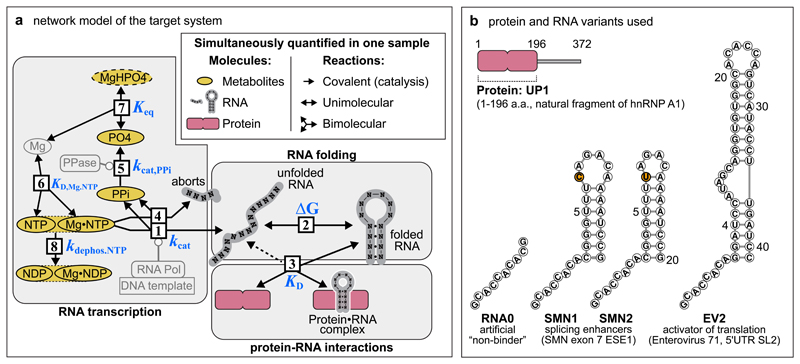
Figure 1. Molecules and reactions of the target co-transcriptional network.
(a) Organization of reactions in the reconstructed network: [1] RNA transcription, [2] RNA folding, [3] binding of regulator protein to RNA (dashed line indicates that protein can also bind to the unfolded RNA), [4] formation of RNA aborts, [5] hydrolysis of pyrophosphate (PPi), [6] formation of Mg NTP (nucleotide triphosphate) complexes, [7] formation of MgHPO4 salt aggregates, [8] dephosphorylation of NTPs to NDPs (nucleotide diphosphates. merged ovals indicate that NMR observables of free and Mg-bound nucleotide-phosphates, e.g. NTP and MgNTP, cannot be separately discriminated). PO4 refers ambiguously to multiple states of phosphate ion, including PO43– and its protonated forms. Indirectly observed MgHPO4 species is shown with dashed contour. Non-observable species – Mg, pyrophosphatase (PPase), RNA Polymerase (abbreviated with RNA Pol), DNA template – are shaded. Metabolites, proteins and RNA are shown in ochre, rose and grey respectively.
(b) Protein and RNA variants used in Systems NMR experiments. To make the products of the abortive RNA transcription uniform in all constructs (panel (a), reaction 4), the hairpin RNAs include a non-native single-stranded 5’ overhang matching the sequence of the control RNA0. The hairpins include two non-native closing GC pairs to offset the instability caused by the 5’-single-stranded overhang. The single C>U mutation between SMN1 and SMN2 RNAs is highlighted in orange. Abbreviations, ESE1 – exonic splicing enhancer 1, UTR - untranslated region, SL2 – stem-loop 2.

