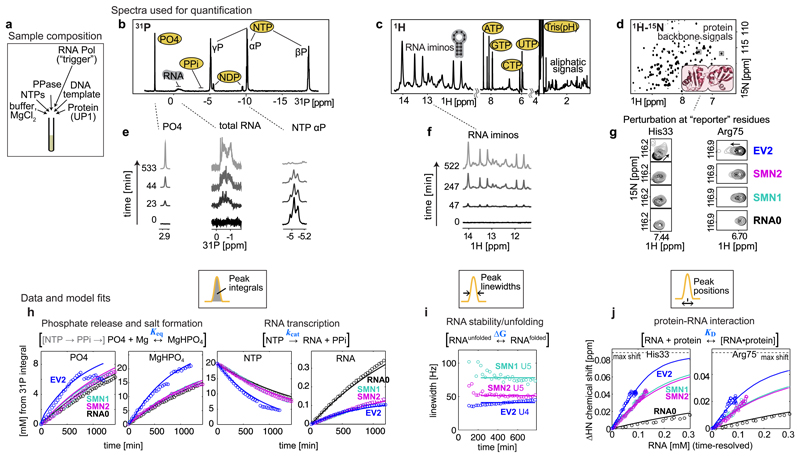
Figure 2. NMR observables, data and mathematical model fits used for network parameterization.
(a) Sample composition, 450 µL NMR tube with 150 µM UP1 protein, 33 nM T7 RNA Polymerase, and 20 mM starting NTPs, from which 0.1-0.4 mM RNA is synthesized by the end of transcription. (b,c,d) Full spectra recorded in the NMR assay. (e,f,g) Selected, time-resolved, spectra regions used for network quantification. From 1D 31P spectra (b,e) the PO4, RNA, PPi, NDPs and NTPs species are quantified using integrals of the corresponding signals. From 1D 1H spectra (c,f) the folded RNA is quantified using linewidths of imino proton signals. 2D 1H-15N spectra (d,g) show a “fingerprint” of all amino acid 1H-15N moieties in the protein, and the positions of selected reporter residues at the RNA binding interface are used to quantify protein-RNA interaction. Experiments were repeated at least three times independently, using different batches of protein and/or DNA template, with similar results (n = 3 (RNA0, SMN1), n = 4 (SMN2, EV2).
(h,i,j) Time-resolved quantified observables used for network parameterization (circles), and the resulting model fits (solid lines). (h) Integrals from 31P spectra converted into mM concentrations using the starting 20 mM NTPs as calibration reference. Abrupt intensity jumps in free PO4 and MgHPO4 are discussed in main text. (i) Linewidths of U5 imino signals in SMN RNAs and U4 in EV2. (j) Chemical shift perturbations of His33 and Arg75 residues of UP1 protein plotted against time-resolved RNA concentration. Time-resolved animation of exemplary data is shown in Supplementary Video 1.

