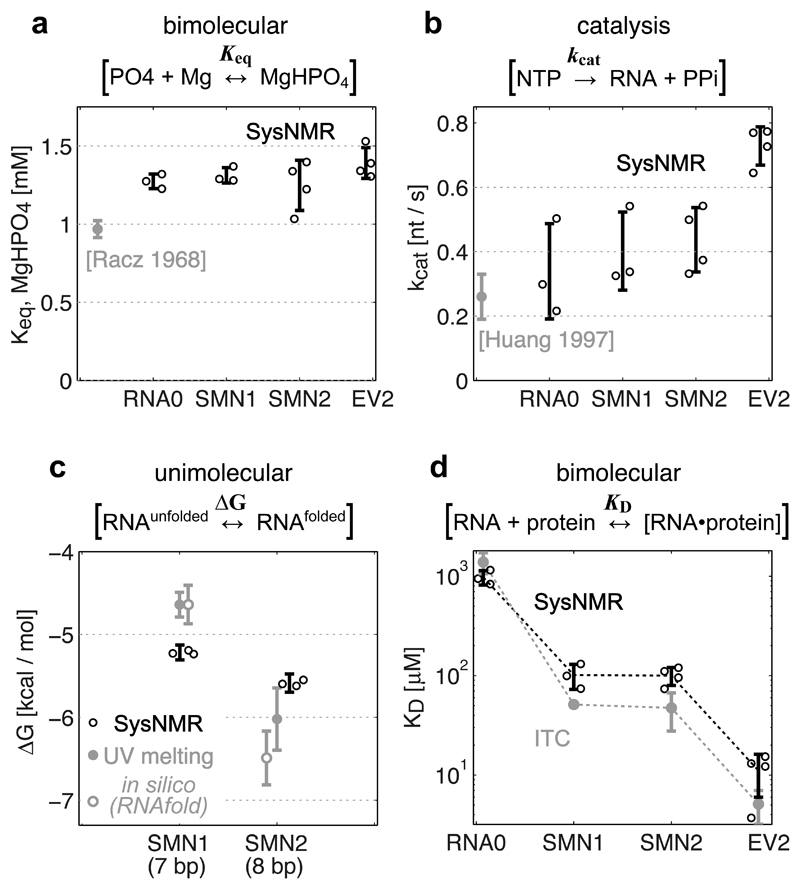
Figure 3. Validation of Systems-NMR-derived constants.
Systems NMR data shown in black, validation data in grey. (a) Equilibrium formation of MgHPO4 salt aggregate constant (from the decrease of total 31P integral), and (b) RNA synthesis rate constant (from the decrease of NTP signals), compared to literature data. (c) Unimolecular free energy of RNA folding (from the linewidths of 1H imino signals) compared to experimental UV-melting data (filled grey circles) and theoretical predictions by RNAfold (empty grey circles). (d) Dissociation constant for protein-RNA complex formation (from the chemical shifts of protein 1H-15N signals) compared to ITC measurements.
In Systems NMR data, the experimental parameter values (Keq, kcat, ΔG, KD) and error bars correspond to the means ± s.d. from independent network model fits using independent experimental dataset replicates (n = 3 (RNA0, SMN1), n = 4 (SMN2, EV2), with different batches of DNA template and/or protein). In the validation experiments, the constants (UV-ΔG, ITC-KD) correspond to the optimized parameter ± s.d. uncertainty of data fits for the melting curve (UV-ΔG) and binding isotherm (ITC-KD). Individual data points, where available, are shown as circles next to the error bars.

