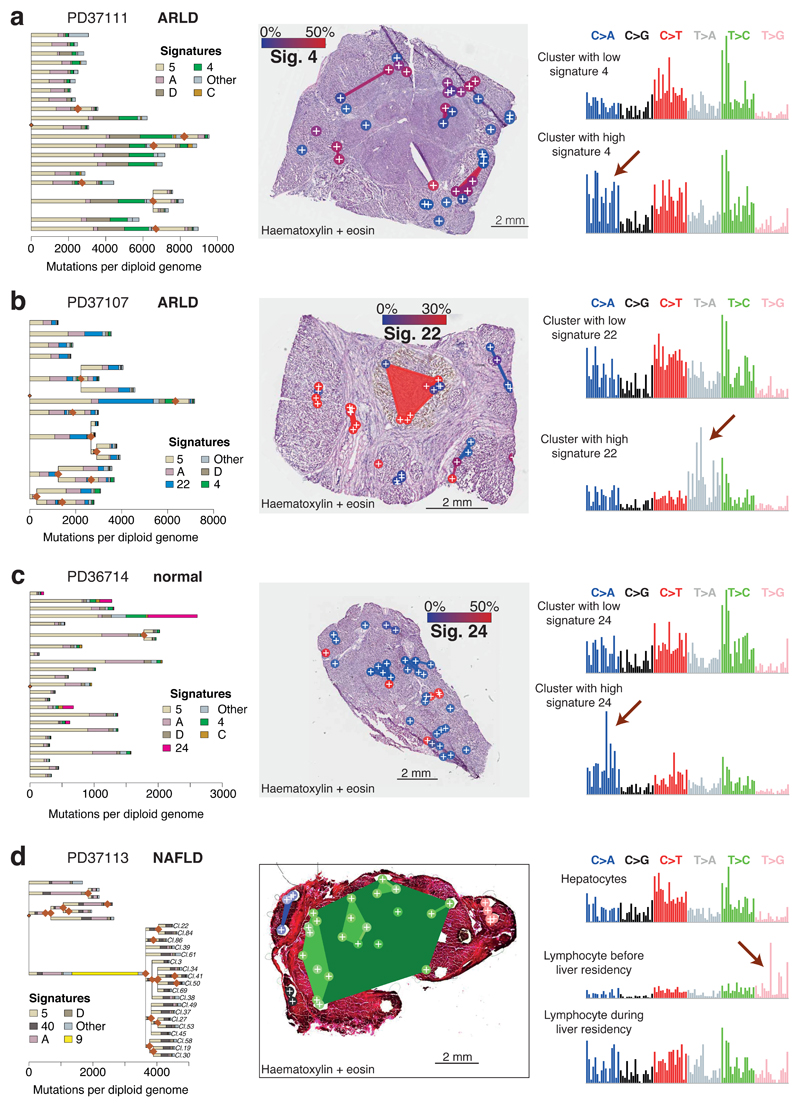
Figure 4. The liver as a witness for mutagenic insults occurring throughout life.
(A) Left panel: Phylogenetic tree of clones in patient PD37111, with each branch coloured by the proportion of mutations in that branch assigned to the different mutational signatures.
Middle panel: Overlay of the clones represented in (A) onto an H+E stained liver section of patient PD37111 (n=39 microdissections). Colouring of clones is according to the proportion of mutations attributed to Sig. 4, linked to tobacco exposure (blue: low activity of Sig. 4, red: high activity of Sig. 4).
Right panel: Representative mutation spectrum for samples with low (top) or high (bottom) burden of Sig. 4. The six substitution types are labelled across the top. Within each substitution type, the contribution from the trinucleotide context are shown as 16 bars. The 16 bars are divided into four sets of four bars, grouped by whether an A, C, G or T respectively is 5’ to the mutated base, and within each group of four by whether A, C, G or T is 3’ to the mutated base.
(B) Overlay of mutational signatures onto phylogenetic tree of clones in patient PD37107 (n=41 microdissections). Colouring of clones in the middle panel is according to Sig. 22, linked to the aristolochic acid carcinogen.
(C) Overlay of mutational signatures onto phylogenetic tree of clones in patient PD36714 (n=35 microdissections). Colouring of clones in middle panel is according to Sig. 24, linked to the carcinogen aflatoxin-B1.
(D) Overlay of mutational signatures onto phylogenetic tree of clones in patient PD37113 (n=37 microdissections). Cluster 10 has many mutations attributed to Sig. 9, linked to the somatic hypermutation process in B lymphocytes.

