
Figure 3.
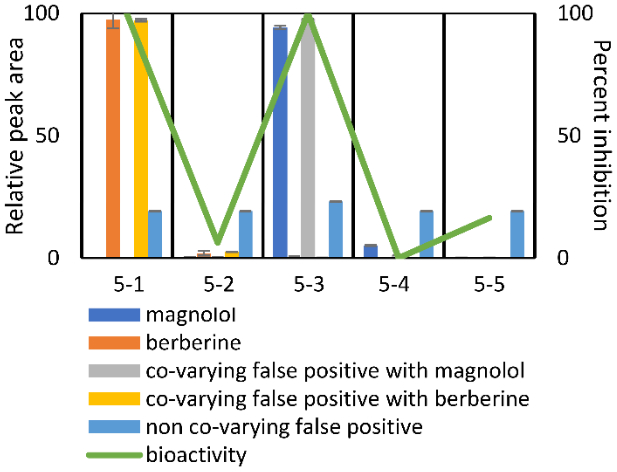
Relative peak area (expressed as a percentage of the total peak area detected across pools) of berberine (compound 1), magnolol (compound 2), and selected “false positives” identified using biochemometric modeling compared to biological activity witnessed in pools 5-1 through 5-5. Berberine and magnolol are responsible for the activity witnessed in pools 5-1 and 5-3, respectively. Co-varying false positives (yellow and gray bars) did not contribute to biological activity, but share the same abundance profiles as true active constituents across pools, and thus statistical models could not disentangle their contributions from those of the true bioactive constituents. A non-co-varying false positive (light blue bar) is also illustrated. This component does not share abundance profiles with active constituents and is found at approximately equal abundance (±5%) across all pools. It represents an example of correlated noise between the biological activity and the concentration data identified by the PLS model.