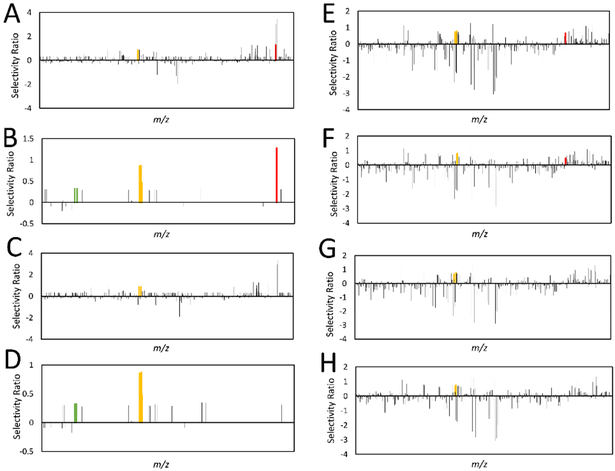
Figure 4.
Comparison of selectivity ratios produced with different data processing approaches. All models were derived from the ten-pool set analyzed at 0.1 mg/mL in the mass spectrometer using bioassay data at 25 μg/mL. m/z-retention time pairs (x-axis, low to high m/z) are plotted relative to their selectivity ratios (y-axis). The most positive bars (selectivity ratios) represent compounds with the highest ratio of explained to residual variance, and are predicted to be associated with biological activity. A series of identified features were associated with berberine and marked in yellow, including an [M]+ ion at m/z 336.123 and retention time (Rt) 2.96 min, an [M]+ ion with an m/z of 338.127 and Rt of 2.961 min (containing two 13C isotopes), an [M]+ ion at m/z 339.129 min and Rt 2.94 (containing three 13C isotopes), and an [M]+ ion at m/z 336.126 at Rt 6.355 min (Rt difference because berberine was retained on the column). Two features were identified as associated with magnolol, and are marked in green, representing the [M-H]− ion at m/z 265.123 and 13C isotope at m/z 266.127 at an Rt of 5.756 min. Polysiloxane contaminants are marked in red. 4A. No data processing approaches were used. 4B. Model simplified using a percent variance cutoff, in which ions showing less than 1% peak area variance across samples (when compared to the most variable peak) were assigned a selectivity score of zero. 4C. Model filtered using hierarchical cluster analysis (HCA), detailed in 14 4D. Model simplified using percent variance cutoff and filtered with HCA. 4E. Model produced using peak area data subjected to a fourth-root transformation. 4F. Model using transformed data and a percent variance cutoff. 4G. Model using transformed data and HCA filtering. 4H. Model produced with transformed data, filtered with HCA, and simplified using a percent variance cutoff. The model produced in Figure 4D has the lowest rate of false positives and the best selectivity ratios for both berberine and magnolol, illustrating that its combination of data processing techniques is most suitable for this application.

