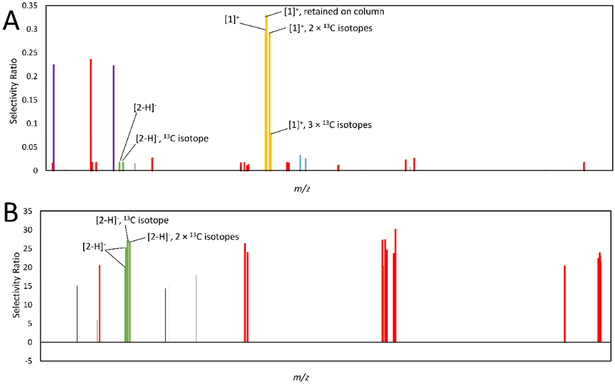
Figure 6.
Models produced using pools 10-1 through 10-10 (6A) and 10-5-1 through 10-5-7 (6B) analyzed at 0.1 mg/mL in the mass spectrometer, and assessed for activity at 25 μg/mL. Features associated with berberine (compound 1) are marked in yellow, and represent an [M]+ ion at m/z 336.123 and retention time (Rt) 2.96 min, an [M]+ ion with an m/z of 338.127 and Rt of 2.961 min (containing two 13C isotopes), an [M]+ ion at m/z 339.129 min and Rt 2.94 (containing three 13C isotopes), and an [M]+ ion at m/z 336.126 at Rt 6.355 min (Rt difference due to column retention). Features associated with magnolol (compound 2) are marked in green. In both 6A and 6B bars represent the [M-H]− ion at m/z 265.123 and 13C isotope at m/z 266.127 at an Rt of 5.756 min. Two additional associated ions, the [M-H]− ion at m/z 265.124 with an Rt of 5.72, and the [M-H]− ion containing 2 13C isotopes at m/z 267.129 with an Rt of 5.73 are found in 6B. Co-varying false positives can be defined as compounds that were identified in the same pools, and with the same relative shifts in concentration, as active compounds. Non-co-varying false positives, on the other hand, were identified as putatively active but did not share concentration patterns with active compounds. In this figure, red bars correspond to variables co-varying with magnolol, blue bars represent false positives co-varying with berberine, and purple bars represent non-co-varying false positives.

