
Fig. 1.
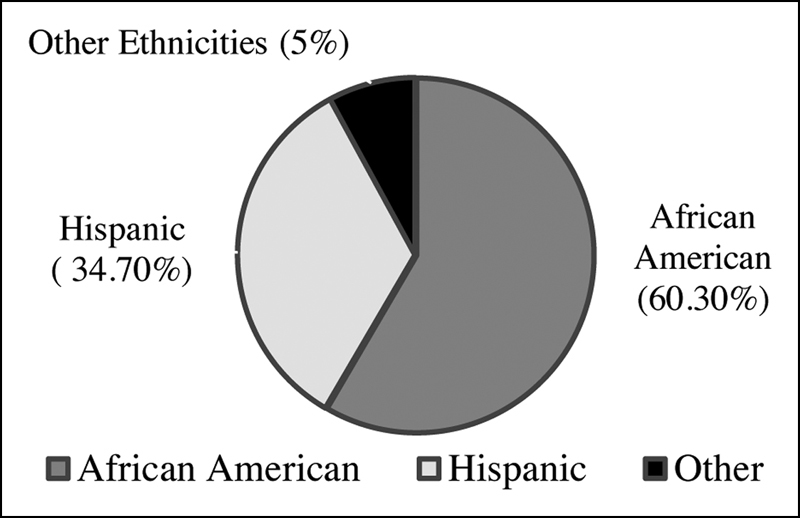
Pie-graph showing distribution of ethnicities. Fig. 1 depicts the distribution of ethnicities. Majority of our study population were African American 60.3% (146/242), followed by Hispanics 34.7% (84/242) and other ethnic groups 5% (12/242).
Official websites use .gov
A
.gov website belongs to an official
government organization in the United States.
Secure .gov websites use HTTPS
A lock (
) or https:// means you've safely
connected to the .gov website. Share sensitive
information only on official, secure websites.
Pie-graph showing distribution of ethnicities. Fig. 1 depicts the distribution of ethnicities. Majority of our study population were African American 60.3% (146/242), followed by Hispanics 34.7% (84/242) and other ethnic groups 5% (12/242).