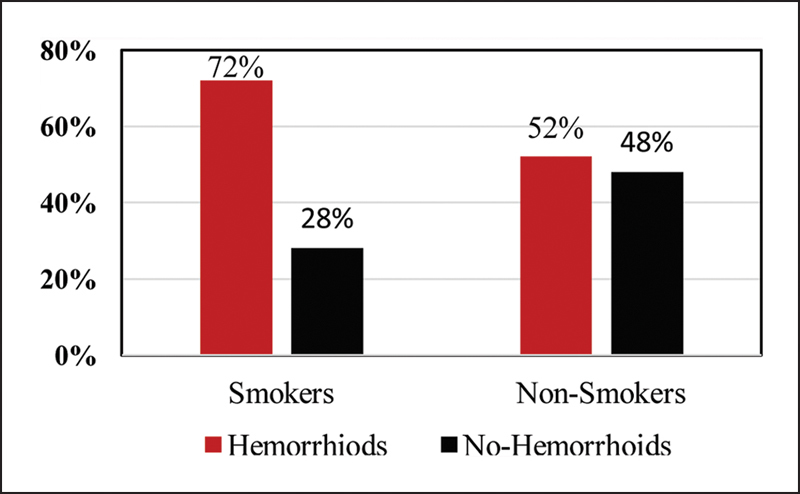
Fig. 2.

Comparison of incidence of hemorrhoids between Group A (smokers) and Group B (nonsmokers). Fig. 2 is a graphical representation of the incidence of hemorrhoids which were significantly higher among the smokers (Group A) with 72% of the population having colonoscopy findings of hemorrhoids when compared with the nonsmokers (Group B) with 52% having findings of hemorrhoids.
